NC Measles Vaccination Data Dashboard
Estimated Measles Vaccination Coverage in NC Elementary Schools
This dashboard shows estimated measles vaccination rates for NC elementary school students.
For actual kindergarten vaccination rates, visit the NC Kindergarten Immunization Data Dashboard.
These estimates of measles, mumps and rubella (MMR) vaccination coverage are based on:
- Current and previous years' NC kindergarten survey data, the National Immunization Survey and CDC's SchoolVaxView dashboard
- Statistics to estimate vaccination rates for schools and counties when data is unavailable
Estimates are shown by county, school and grade level (K-5). This information helps identify areas and groups that might have lower vaccination rates. NCDHHS shares resources with these areas and groups to help prevent disease spread.
To learn more about the data and how these estimates are made, visit "About the Dashboard."
For the best user experience, please visit this dashboard on desktop.
The measles dashboard was updated on 2/24/26 to provide more accurate estimates of measles vaccination coverage.
This improvement incorporates MMR-specific vaccination rates from kindergarten school vaccination compliance reports, replacing previous reliance on overall compliance rates.
This update also resolves issues with incorrect kindergarten immunization data submitted from schools in some jurisdictions.
About Measles
Measles is a very contagious disease that spreads through the air when someone who has measles talks, coughs or sneezes.
Measles can cause serious health problems. Your best protection against measles is the MMR vaccine. Two doses prevent the disease in 97% of people. Most people are protected for life after getting the vaccine.
To keep a community safe, at least 95% of people need to be vaccinated. If vaccination rates drop below that, outbreaks are more likely to happen.
More information:
This dashboard shows estimated measles vaccination rates for students in North Carolina. You can look at the data by county, school and grade.
Every year, NC schools report the vaccination status of children starting kindergarten. Sometimes this information is missing because of reporting delays or other issues. Data is not routinely available for elementary students beyond 30 days of kindergarten enrollment.
When data is missing, we use estimates from a statistical model to fill in the gaps. This model combines:
- Information from state vaccination surveys
- Data from other schools in the same county
- Data from other years in the same school when it is available
For more information, see "Data Limitations."
Detailed Explanation of the Dashboard
North Carolina collects aggregated vaccination data from schools each year for kindergarten students, as required by state law. These reports are shown in the NC Kindergarten Immunization Data Dashboard. We use the following information from these reports:
- The total number of students enrolled in kindergarten each year
- The total number of kindergartners who are up-to-date on the MMR vaccine.
Additional vaccination estimates come from:
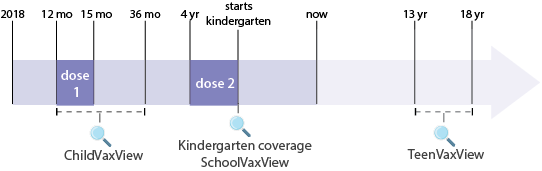
- The National Immunization Survey (NIS). NIS coverage estimates are available for:
- Infant/toddler age group (13-35 months)
- Middle and high school age group (13-17 years)
- The Centers for Disease Control and Prevention (CDC), which provides state-level data reported by state immunization programs through the CDC SchoolVaxView dashboard.
County-Level Estimates Shown on the Dashboard
- Overall county vaccination coverage: The percentage of K-5 students in the county who are estimated to be up-to-date on the MMR vaccine. This is calculated by dividing the estimated total number of K-5 students up to date on the MMR vaccine by the total number of K-5 students in the county.
- Proportion of students at under-vaccinated schools: The percentage of students enrolled in elementary schools where less than 95% of students are up to date on the MMR vaccine. This is calculated by dividing the estimated number of students at K-5 schools with less than 95% vaccination coverage by the estimated total number of K-5 students in the county.
School and Grade-Level Estimates
The dashboard shows estimates of MMR vaccination coverage at the school- and grade-levels.
- Overall school coverage: The percentage of K-5 students in a school who are up to date on the MMR vaccine. This is calculated by dividing the estimated total number of K-5 students in the school who are up to date on the MMR vaccine by the total number of K-5 students in the school.
- Grade-level coverage: The percentage of students in each grade who are up to date on the MMR vaccine. This is calculated by dividing the estimated total number of students in the grade who are up to date on the MMR vaccine by the total number of students in the grade.
For privacy, estimates are not shown for grades where enrollment data suggest there are fewer than 10 students. In this case, the data is marked as "suppressed for privacy."
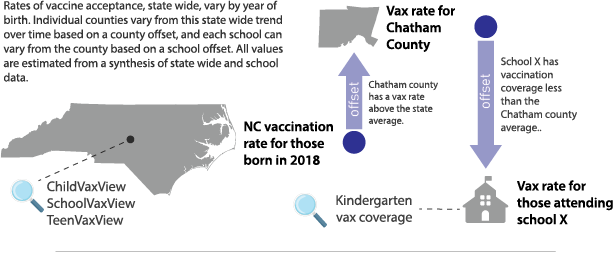
When schools report vaccination coverage, those numbers are shown on the dashboard. But not every school reports each year, and the most recent kindergarten data (2025-26) is not yet available. In those cases, the dashboard uses estimates which are based on:
- State-level exemption rate (the fraction of children who will be exempt for medical or other reasons), which changes year-to-year,
- Each county's difference from that state-level average exemption rate,
- Each school's difference from its county average exemption rate, and
- Statewide proportion of non-exempt children vaccinated every year
Using these values, we can then calculate the non-exempt fraction who were vaccinated by the time they started kindergarten for each grade, school and county.
- Only schools that have submitted some annual immunization reports are included.
- Data for schools with fewer than 10 students in every grade are not shown to protect privacy (though these do contribute to estimating county-level trends).
- Vaccination status is captured at day 30 of kindergarten (unless the deadline is extended by an executive order). Vaccinations given later in the year are not included for kindergarten estimates. This data is not available typically until after the school year is complete.
- Schools self-report their data. The state reviews it for errors and completeness and contacts schools to confirm or resubmit if needed. Still, some data errors or reporting biases may remain.
- Coverage values do not account for students who move in or out of a school after kindergarten entry or who get vaccinated after day 30 of kindergarten enrollment.
- State-level coverage based on National Immunization Survey (NIS) data only covers a small sample of children in the state.
- CDC estimates of kindergarten coverage are based on state reports and may have the same limitations as school-level data.
This dashboard was developed in partnership with the Atlantic Coast Center for Infectious Disease Dynamics and Analytics (ACCIDDA).