North Carolina Injury Data User Toolkit
The NC Injury Data User Toolkit helps injury data users navigate and understand the data resources the NCDHHS Injury and Violence Prevention Branch (IVPB) creates. The branch's Epidemiology, Surveillance and Informatics (ESI) Unit provides the resources.
The goals of this toolkit are to:
- Increase data literacy
- Establish and promote a base understanding around injury data among Department leadership, our partners, the media and other injury data users.
- Ensure IVPB data resources are understandable and actionable
- Provide resources that support the use of injury data to help address injury and violence in NC.
- Promote data to knowledge to action.
What's in the Toolkit?
The toolkit explains:
- How we do things: Describes how IVPB processes data and key decisions applied to the data.
- Why we do things: Outlines nuances and considerations for using injury and violence data.
- Where data resources are located: Helps users find the data they seek.
- How to use IVPB data resources: Explains which data resources can be used for what purposes.
What to Know About IVPB Injury Data
The sections below describe:
- The data sources IVPB uses, and how IVPB monitors injuries and violence in NC
- Concepts in injury surveillance, like counts and rates, and injury mechanism and intent
Content in these sections is also available as stand-alone, downloadable PDF documents.
What You Should Know By Injury Topic
Resources and considerations for using data on specific types of injuries.
Overview
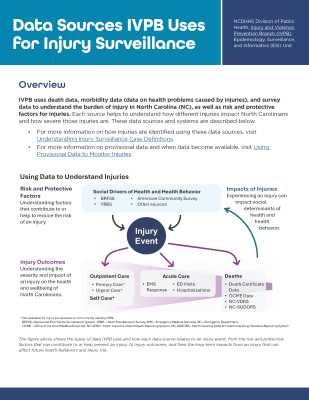
IVPB uses death data, morbidity data (data on health problems caused by injuries), and survey data to understand the burden of injury in North Carolina (NC), as well as risk and protective factors for injuries. Each source helps to understand how different injuries impact North Carolinians and how severe those injuries are. These data sources and systems are described below.
- For more information on how injuries are identified using these data sources, visit Understanding Injury Surveillance Case Definitions.
- For more information on provisional data and when data become available, visit Using Provisional Data to Monitor Injuries.
Using Data to Understand Injuries
IVPB uses many data sources to understand aspects of an injury event, including risk and protective factors, injury outcomes, and the impacts of injuries.
Some social factors (social drivers of health) and health behaviors can raise a person’s risk of injury. But getting injured can also affect those same social factors and behaviors, which may increase the chances of another injury.
Risk and Protective Factors
Understanding factors that contribute to or help reduce the risk of an injury.
| Topic | Data Sources |
|---|---|
| Social Drivers of Health and Health Behavior |
|
Injury Outcomes
Understanding the severity and impact of an injury on the health and wellbeing of North Carolinians
| Topic | Data Source |
|---|---|
| Deaths |
|
| Acute Care |
|
Outpatient Care
| Data are not available or not currently used by IVPB. |
Self-Care
| Data are not available or not currently used by IVPB. |
Death Data
| Data Source | Source | Description | Timeframe Available | Data Elements | Considerations |
|---|---|---|---|---|---|
| Death Certificate Data | NC State Center for Health Statistics (SCHS) |
| 1999-present |
|
|
| Medical Examiner Data | Office of the Chief Medical Examiner (OCME) |
| 2004-present |
|
|
| NC-VDRS | IVPB |
| 2004-present |
|
|
| NC-SUDORS | IVPB |
| 2018-present |
|
|
Morbidity (Non-Fatal) Data
| Data Source | Source | Description | Timeframe Available | Data Elements | Considerations |
|---|---|---|---|---|---|
| Hospital Discharge Data | NC Healthcare Association via NC SCHS |
| 2016 - Present; 2015 data not shared; 2006 - 2014 |
|
|
| Emergency Department (ED) Visit Data | North Carolina Disease Event Tracking and Epidemiologic Collection Tool (NC DETECT) |
| 2016 - Present; 2015 data not shared; 2008 - 2014 |
|
|
| Emergency Medical Services (EMS) Data | NC DETECT |
| 2020 - Present |
|
|
Survey Data
| Data Source | Source | Description | Timeframe Available | Data Elements | Considerations |
|---|---|---|---|---|---|
| NC Behavioral Risk Factor Surveillance System (BRFSS) | NC SCHS |
| 2013 - Present |
|
|
| NC Youth Risk Behavior Survey (YRBS) | NC Department of Public Instruction (DPI) |
| 2013 - Present |
|
|
Other Data Sources
| Data Source | Source | Description | Timeframe Available | Data Elements | Considerations |
|---|---|---|---|---|---|
| Population Data | National Center for Health Statistics (NCHS) |
| 2000 - Present |
|
|
| Homelessness Management Information System (HMIS) | NC Coalition to End Homelessness (NCCEH) |
| 2016 - Present |
|
|

What are Provisional Data?
Provisional data are early numbers or datasets with the information that is available now.
- These data have not yet been fully checked.
- They don't have all the information they normally would have before being considered final.
Why Does IVPB Use Provisional Data?
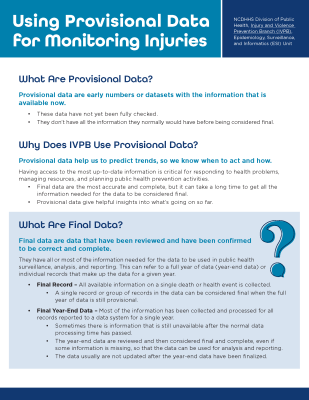
Provisional data helps us to predict trends, so we know when to act and how.
Having access to the most up-to-date information is critical for responding to health problems, managing resources and planning public health prevention activities.
- Final data are the most accurate and complete, but it can take a long time to get all the information needed for the data to be considered final.
- Provisional data give helpful insights into what's going on so far.
What are Final Data?
Final data are data that have been reviewed and have been confirmed to be correct and complete.
They have all or most of the information needed for the data to be used in public health surveillance, analysis and reporting. This can refer to a full year of data (year-end data) or individual records that make up the data for a given year.
- Final Record - All available information on a single death or health event is collected.
- A single record or group of records in the data can be considered final when the full year of data is still provisional.
- Final Year-End Data - Most of the information has been collected and processed for all records reported to a data system for a single year.
- Sometimes there is information that is still unavailable after the normal data processing time has passed.
- The year-end data are reviewed and then considered final and complete, even if some information is missing, so that the data can be used for analysis and reporting.
- The data usually are not updated after the year-end data have been finalized.
Considerations for Using Provisional Data?
Provisional data should be used carefully because there may be missing information or delays in reporting.
- Because data are always being collected and updated, provisional data can change as new information is added.
- How complete provisional data are varies by data source, data system and when the data are accessed.
- The quality and completeness of the information can also be different for different groups of people in the same data source.
Whenever provisional data are used, a note should be included to share with audiences that the data are provisional.
- This allows people using the data to know that the data can change so they can use the data appropriately.
- For example:
- Report Title: North Carolina Emergency Department (ED) Visits for Opioid Overdose: April 2025* Update
- Report Footnote: *Data for 2024-2025 ED visits are provisional.
Provisional death certificates may have a pending cause of death code (R99) listed for a record while the death is still being investigated. This cause of death code is usually updated to a code for a specific cause of death before the data are finalized.
Example Provisional Death Certificate Record
| First Name | Last Name | Sex | Age | Race/Ethnicity | Cause of Death | Description |
|---|---|---|---|---|---|---|
| John | Doe | Male | 44 | Non-Hispanic White | R99 | Ill-defined and unknown cause of mortality |
Example Final Death Certificate Record
| First Name | Last Name | Sex | Age | Race/Ethnicity | Cause of Death | Description |
|---|---|---|---|---|---|---|
| John | Doe | Male | 44 | Non-Hispanic White | X42 | Accidental poisoning by and exposure to narcotics and hallucinogens |
Benefits and Drawbacks to Using Provisional Data
Using provisional data gives us information more quickly
We can use provisional data to:
- Spot changes early, before the final data are completely ready.
- See patterns that help us know when to take action, even if numbers might not be exact.
Provisional data can change and might not be complete
The quality and completeness of the information can also vary for different groups of people and for different types of injuries.
- It takes longer to finalize data about violent deaths and overdose deaths because they need more time for investigation.
- To learn more about provisional overdose data, visit Using Provisional Overdose Data.
The quality and speed of provisional data is different across data sources and systems.
- Each data source or data system checks and finalizes data in its own way.
- This affects how complete provisional data are and how long it takes for a full year of data to be considered final.
- IVPB allows time to pass (lag-time) before using provisional data to make sure as much information is available for each record as possible.
- Provisional data are used until the year-end data are considered final.
Estimated Data Lag-Time in Months by Data Source
| Data Source | Provisional Data | Final Year-End Data |
|---|---|---|
| ED Visit Data | One month | Six months |
| EMS Data | One month | Six months |
| Hospital Discharge Data | Six months | Eight months |
| Death Certificate Data | Six months | 14 months |
| NC-SUDORS Data | 12 months | 16 months |
| NC-VRDS Data | 14 months | 16 months |
Availability of Data for Injury Surveillance by Data Source
Death Data
- Death Certificate Data
- There is a longer wait for final death certificate data than other data sources because it takes time to investigate deaths, finish death certificates and enter updated data into the system.
- Coding of death certificates currently takes longer in NC than in most other states. That is because of system changes as well as delays in autopsy reporting and pathology reviews for legal purposes.
- It can take as long as 14 months from the end of the calendar year before a full year of data are considered final.
- For deaths that occur in January, that is as long as 26 months before they are included in a final year-end data set.
- IVPB waits about six months after a death occurs before using provisional data to make sure most records have been assigned to a specific cause of death code.
- IVPB gets provisional death certificate data from the State Center for Health Statistics (SCHS) every month.
- Provisional datasets include all deaths that have been reported so far.
- Although a death may be reported in the provisional data set, important details like the cause of death code may not be available yet.
- It can take as long as 14 months from the end of the calendar year before a full year of data are considered final.
- NC Violent Death Data Reporting System (NC-VDRS)
- NC-VDRS uses information from several different sources to help us understand violent deaths. It takes time to gather and review all the details.
- There is a delay of about 16 months from the end of the calendar year before NC-VDRS data are ready.
- Provisional data can be used once the most important information is added to the system, like manner of death, weapon type and victim demographics.
- This timeline depends on when data become available from the data sources that are used to populate NC-VDRS.
- Information on the circumstance surrounding the death takes the longest to collect since these fields are based on both medical examiner and law enforcement reports.
- Toxicology data and information on firearm type also take longer to finalize.
- NC-VDRS uses information from several different sources to help us understand violent deaths. It takes time to gather and review all the details.
- NC State Unintentional Drug Overdose Reporting System (NC-SUDORS)
- NC-SUDORS uses information from several different sources to help us understand unintentional and undetermined overdose deaths. It takes time to gather and review all the details.
- There is a delay of about 12 months from the end of the calendar year before these data are ready.
- Provisional data can be added once the most important information is added to the system.
- This timeline depends on when data become available from the data sources that are used to populate NC-SUDORS.
- NC-SUDORS uses information from several different sources to help us understand unintentional and undetermined overdose deaths. It takes time to gather and review all the details.
Non-Fatal Data
- Hospital Discharge Data
- It takes about six to eight months from the end of the calendar year before a full year of hospital discharge data is considered final.
- For hospitalizations early in the year, that could be a delay of as long as 20 months before records are available in a final year-end dataset.
- Provisional data are used after about six months to be sure the information is as complete as possible for most of the provisional hospitalization records.
- IVPB gets updated provisional data on hospital discharges from the NC Healthcare Association every three months (quarterly) via the NC SCHS.
- These updates include all reported information for hospitalizations that have occurred so far for that year.
- It takes about six to eight months from the end of the calendar year before a full year of hospital discharge data is considered final.
- Emergency Department (ED) Visit Data from North Carolina Disease Event Tracking and Epidemiologic Collection Tool (NC DETECT)
- ED visit data from NC DETECT are among the timeliest data available for injury surveillance.
- It usually takes about six months after a full year of ED visits occur before ED data are considered final.
- Provisional ED visit data are used after about one month to be sure the information is as complete as possible.
- ED visit data are also the most complete provisional data among the data sources IVPB uses.
- Provisional data are available to authorized users within the NC DETECT data portal in near real-time.
- IVPB gets updated provisional data on ED visits from NC DETECT each month.
- Once all of the information for a record is entered into the system, it is unlikely the provisional ED visit data will change.
- ED visit data from NC DETECT are among the timeliest data available for injury surveillance.
- Emergency Medical Services (EMS) Data from NC DETECT
- Like ED visit data, EMS data are available much faster from other data sources for injury surveillance.
- It usually takes about six months after a full year of EMS responses before EMS data are considered final.
- Provisional EMS visit data are used after about one month to be sure the information is as complete as possible.
- IVPB gets updated provisional data from NC DETECT each month.
- Provisional data are also available to authorized users within the NC DETECT data portal in near real-time.
- Like ED visit data, EMS data are available much faster from other data sources for injury surveillance.
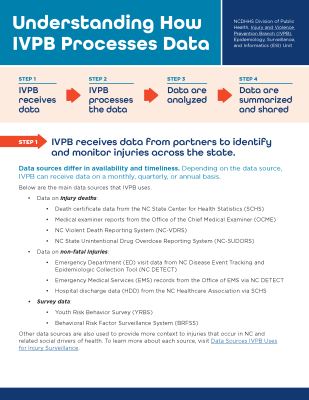
Step 1: IVPB receives data from partners to identify and monitor injuries across the state.
Data sources differ in availability and timeliness. Depending on the data source, IVPB can receive data on a monthly, quarterly or annual basis.
Below are the main data sources that IVPB uses.
- Data on injury deaths:
- Death certificate data from the NC State Center for Health Statistics (SCHS)
- Medical examiner reports from the Office of the Chief Medical Examiner (OCME)
- NC Violent Death Reporting System (NC-VDRS)
- NC State Unintentional Drug Overdose Reporting System (NC-SUDORS)
- Data on non-fatal injuries:
- Emergency Department (ED) visit data from NC Disease Event Tracking and Epidemiologic Collection Tool (NC DETECT)
- Emergency Medical Services (EMS) records from the Office of EMS via NC DETECT
- Hospital discharge data (HDD) from the NC Healthcare Association via SCHS
- Survey data:
- Youth Risk Behavior Survey (YRBS)
- Behavioral Risk Factor Surveillance System (BRFSS)
Other data sources are also used to provide more context to injuries that occur in NC and related social drivers of health. To learn more about each source, visit Data Sources IVPB Uses for Injury Surveillance.
Step 2: IVPB processes the data to identify specific types of injuries.
Each data file IVPB receives is processed to customize the data for use in injury surveillance and is then stored to keep the information private and secure.
- The data are checked for the important details that help to identify and describe injuries.
- IVPB applies case definitions to the data to identify specific types of injuries.
- Cases are identified and grouped by injury mechanism and intent.
- IVPB takes time to understand how national case definitions work when used with NC data and has developed additional NC definitions.
- To learn more about surveillance case definitions, visit Understanding Injury Surveillance Case Definitions.
- To review the specific case definitions IVPB uses, visit North Carolina Injury and Violence Prevention Branch Injury Case Definitions.
- The data are organized into groups based on things like sex, age, race/ethnicity, location and other important factors to prepare the data for analyses.
- IVPB explores how best to define and identify specific groups, locations and lived experiences in the data.
- IVPB makes efforts to use categories to group people that are fair and accurate.
- Fair – Assigned without bias
- Accurate – Match the true characteristics or experiences of the groups
Step 3: Once the data are in a format that can be used for injury surveillance, they are analyzed.
Data are analyzed to understand who is impacted by injuries in NC, what types of injuries are happening, when and where injuries are happening, and why.
- IVPB uses data to monitor injury trends over time and identify groups and counties or regions of the state that are most impacted by injuries.
- IVPB analyzes data by demographic factors like sex, age, racial/ethnic group, and by place (region, county or census tract).
- Injury and violence data are also reported to the Centers for Disease Control and Prevention (CDC) to be used in national injury surveillance for all states.
- IVPB often incorporates data from additional data sources to understand risk and protective factors that can contribute to or help to prevent injuries.
- IVPB links data to other sources to help answer questions about injuries that cannot be answered from a single dataset.
Step 4: Data are summarized and shared to help inform response and prevention activities.
IVPB creates a variety of data resources including interactive data dashboards, fact sheets, slide decks and data reports.
- These resources summarize injury trends in NC to help explain who is being impacted and where injuries are occurring.
- These data are shared with public health leadership and with partners across the state to focus prevention efforts and guide public health decision making.
- Resources are often developed in collaboration with state and local government, nonprofit, and university partners to be sure they include the information and prevention messaging most helpful for public health planning.
- Some resources are updated monthly or quarterly with provisional data, while other resources are updated annually after final data are available.
- For more information, visit How IVPB Uses Provisional Data.
- Data resources are also posted to the IVPB website for public use.
More Resources
- Visit the Interactive Data Inventory for a full list of IVPB data resources. This tool can be used to search for the data resources that include the type of data you need.
- IVPB also processes custom data requests from the media, elected officials, other agencies and the public for information that might not be found in a resource listed in the Data Inventory. For more information on how to request injury data and the timeline for the data request process, visit the Data Request Policy and Procedure page.
- For more information on considerations for analyzing and sharing public health data, visit Council of State and Territorial Epidemiologist Data Release Reference Document.
There are many reasons why different data sources may report different numbers of injuries.
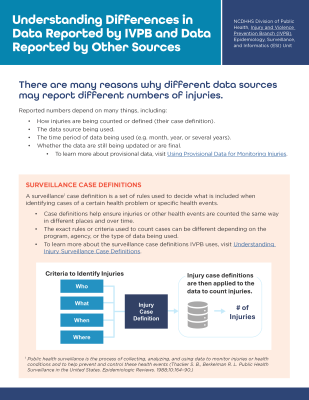
Reported numbers depend on many things, including:
- How injuries are being counted or defined (their case definition).
- For more information, visit Injury Surveillance Case Definitions.
- The data source being used.
- The time period of data being used (e.g., month, year, or several years).
- Whether the data are still being updated or are final.
- To learn more about provisional data, visit Using Provisional Data for Monitoring Injuries.
Below are examples of known differences in reported injury death data.
Differences Between IVPB Death Data and National Death Data Sources
Data on deaths in NC due to violence, overdose, and other injuries are included in several national interactive data portals. Most of these tools use death certificate data from the National Vital Statistics System (NVSS).
Below are some reasons why data shared through these national systems can be different from data shared by IVPB.
Differences When Using Provisional Data
- Delays in Reporting
- There is a delay in cause of death coding in the death certificate data because of the time it takes to investigate deaths and complete the death certificate.
- Delays can be longer for some injuries, like overdoses and violent deaths.
- Many indicators that use the NVSS provisional data count cases based on the cause of death information reported in the data at that point in time.
- This can underestimate the number of some deaths, like overdoses, where some records may not have a specific cause of death code yet.
- IVPB uses data from the Office of the Chief Medical Examiner (OCME) to monitor early numbers of overdose deaths.
- These indicators often show higher numbers of overdose deaths than provisional death certificate data because of the delays in death certificate coding.
- For more information visit, Using Provisional Data for Monitoring Injuries and Using Provisional Overdose Data.
- There is a delay in cause of death coding in the death certificate data because of the time it takes to investigate deaths and complete the death certificate.
- Who is Included?
- Some national sources of provisional data do not restrict data to deaths among residents.
- All reported cases are used, including those among residents of other states and countries.
- Most IVPB reports using provisional data are limited to NC residents.
- Final national datasets do limit data to residents, which may then show different numbers of deaths than were shown in the provisional data.
- For more information on data by occurrence (where a death happened) vs residence status, visit Understanding Injury Surveillance Case Definitions.
- Some national sources of provisional data do not restrict data to deaths among residents.
- Final Data
- Once the NVSS death certificate data are considered closed or final, the data are “frozen”.
- Data are no longer updated even if additional records are submitted by states or jurisdictions to NVSS.
- “Freezing” data provides a single reference file for analysis and helps ensure consistency in the data.
- Some records in the final annual NVSS file will have an unknown or pending cause of death even if the information becomes available later.
- NC continues to update information in the state Vital Records system at the NC State Center for Health Statistics (SCHS) after the national file is closed.
- Updates made to the NC file after the NVSS data are finalized can create discrepancies between the final national and state death certificate data.
- The SCHS also creates a final “frozen” death file once the SCHS has finalized most death certificates for that year. It may or may not match the NVSS final file.
- Once the NVSS death certificate data are considered closed or final, the data are “frozen”.
Violent Death Reporting System (VDRS) and State Unintentional Drug Overdose Reporting System (SUDORS)
- IVPB reports data from the NC-VDRS and NC-SUDORS to the Centers for Disease Control and Prevention (CDC) to be included in the National VDRS and SUDORS.
- There can be differences in the number of violent deaths and overdoses reported between the state systems and the national systems.
- Differences can be caused by delays with cause of death coding in the death certificate data.
- NC-VDRS and NC-SUDORS continue to be updated after the national systems are closed out or “frozen”.
Differences Between IVPB Death Data and Other NC Data Sources
Differences Between Data from IVPB and the NC Data Portal
The NC Data Portal provides access to data to support community health assessments and inform other public health activities. This tool includes several different indicators on overdose, violence, and other types of injuries.
- Most of the NC Data Portal indicators use age-adjusted rates, where IVPB normally uses crude rates.
- For more information on the difference between crude and age-adjusted rates, visit Understanding Counts and Rates.
- Some of the NC Data Portal indicators come from national data sources and may not be the same as the data IVPB shares on these same injury topics.
- See the Differences Between IVPB Death Data and National Death Data Sources section in this document for more context.
- IVPB substance use and injury epidemiologists consult with national leaders, state data providers, and other experts to be sure they are counting injuries and overdoses as accurately as possible using NC data.
- Because of this, the NC Data Portal may use different case definitions than IVPB.
- For more information, visit Understanding How IVPB Processes Data and Understanding Injury Surveillance Case Definitions.
- There can also be differences due to the timeliness of data.
- IVPB tends to have more recent data posted than the data included in the NC Data Portal.
- For more information, visit Using Provisional Data for Monitoring Injuries.
Differences Between NC OCME and NC Death Certificate Data
IVPB uses both NC OCME and death certificate data for monitoring injury fatalities, depending on the topic or the purpose of the data resource. Data from OCME and death certificate data from SCHS can differ for many reasons, including the different purposes of these two systems.
- The cause of death on a death certificate is the medical opinion of the death certifier based on the information available at the time of death.
- There can be a difference of medical opinion between the professional certifying the death and the medical examiner (ME) after investigation.
- MEs investigate deaths that are unexplained, unexpected, or that are due to injury, violence, or poisoning.
- They do not investigate all deaths, but do investigate most injuries.
- Death certificate data include many natural deaths that are not included in OCME data.
- OCME data may include investigated deaths that are not included in death certificate data because OCME investigates all deaths occurring in NC, not just deaths among NC residents.
- During the ME and law enforcement investigations, more information can become available that shows the death was due to a different cause than what is on the death certificate.
- For example, a death certificate may show unintentional firearm injury as the cause, but after further investigation the death was determined MEs to be a firearm homicide.
This information is not always available before the annual death certificate data file is finalized and “frozen”, so the same death could have a different cause/intent in each system.
- For example, a death certificate may show unintentional firearm injury as the cause, but after further investigation the death was determined MEs to be a firearm homicide.
- OCME does not “freeze” their data and continuously updates data as information becomes available.
- This can contribute to differences between OCME data and death certificate data since death certificate data are closed and “frozen” each year.
- OCME data may include deaths among non-residents that are not included in the death certificate data.
There can also be differences between data included in IVPB products and data published by the SCHS and OCME. Differences in data can depend on which source of data is being used, which case definition is being applied to the data, and if the data are provisional or final.
Differences Between NC Death Certificate Data and Data From NC-VDRS and NC-SUDORS
NC-VDRS and NC-SUDORS are both multi-source data systems that compile data from death certificates, ME reports, and law enforcement reports.
- Data captured in NC-VDRS and NC-SUDORS are based on evidence from all data sources used to populate these systems.
- The CDC coding manual is used to determine SUDORS and VDRS case inclusion or exclusion, but the manner of death in NC-VDRS and NC-SUDORS is heavily influenced by both the death certificate and ME data.
- NC-VDRS and NC-SUDORS data are limited to deaths that happened in NC, where final death certificate data also include deaths among NC residents that happened outside of the state.
- NC-VDRS and NC-SUDORS process deaths on a later timeline than the death certificate data.
- NC-VDRS and NC-SUDORS may include information that was not available when the death certificate file was closed or “frozen.”.
- This can result in a final cause and manner of death that is different than what is listed on the death certificate.
- Any updates to the manner and cause of death in NC-VDRS or NC-SUDORS are not made to the death certificate file if it has already been “frozen.”
- Legal intervention deaths, or deaths caused by law enforcement officers or other authorized personnel using deadly force in the line of duty, is its own category of violent death in the NC-VDRS.
- These deaths are always coded as homicides in the death certificate data.
Differences Between NC OCME Data and Data From NC-VDRS and NC-SUDORS
- There can be differences between NC OCME and the NC-VDRS and NC-SUDORS data because of the case definitions used to identify causes and manners of deaths between OCME and these two systems.
- The case definitions NC-VDRS and NC-SUDORS use are similar to case definitions used by NC OCME for many causes and manners of death but do not align for all kinds of deaths.
- CDC’s coding manual is used to determine SUDORS and VDRS case inclusion or exclusion, but the manner of death in NC-VDRS and NC-SUDORS is heavily influenced by both death certificate and ME data.
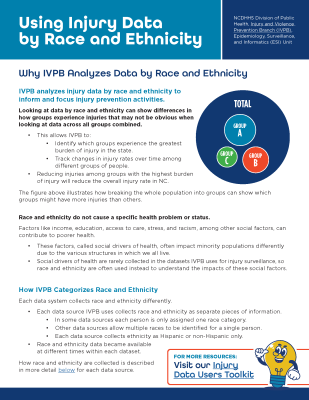
IVPB analyzes injury data by race and ethnicity to inform and focus injury prevention activities.
Looking at data by race and ethnicity can show differences in how groups experience injuries that may not be obvious when looking at data across all groups combined.
- This allows IVPB to:
- Identify which groups experience the greatest burden of injury in the state.
- Track changes in injury rates over time among different groups of people.
- Reducing injuries among groups with the highest burden of injury will reduce the overall injury rate in NC.
Race and ethnicity do not cause a specific health problem or status.
Factors like income, education, access to care, stress, and racism, among other social factors, can contribute to poorer health.
- These factors, called social drivers of health, often impact minority populations differently due to the various structures in which we all live.
- Social drivers of health are rarely collected in datasets IVPB uses for injury surveillance, so race and ethnicity are often used instead to understand the impacts of these social factors.
How IVPB Categorizes Race and Ethnicity
Each data system collects race and ethnicity differently.
- Each data source IVPB uses collects race and ethnicity as separate pieces of information.
- In some data sources, each person is only assigned one race category.
- Other data sources allow multiple races to be identified for a single person.
- Each data source collects ethnicity as Hispanic or non-Hispanic only.
- Race and ethnicity data became available at different times within each dataset.
How race and ethnicity are collected is described in more detail below for each data source.
How data are collected and grouped can impact our ability to understand differences in injuries by race and ethnicity.
The most reliable way to collect information on race and ethnicity is when it is self-reported, where individuals choose the race(s) and ethnicity that describes them.
This ensures the data are accurate.
- Assigning race and ethnicity based solely on how someone looks can be inaccurate and cause misclassification (grouping someone into a different race/ethnicity group than they identify) and contribute to continued racial biases.
Federal standards for collecting, analyzing, and presenting data by race and ethnicity were updated in 2024. Not all of the data sets IVPB uses align with these updated guidelines.
IVPB recategorizes race and ethnicity data for injury surveillance.
IVPB regroups race and ethnicity information within each data source. This process formats race and ethnicity data the same way, so data can be compared across data sources.
- Race and ethnicity information is combined into a single category. One race/ethnicity category is assigned to each person using the categories below for consistency across each data source.
- How this is done is explained for each data source in the next section.
| IVPB Race/Ethnicity Categories |
|---|
| Hispanic (of any racial group) |
| Non-Hispanic White |
| Non-Hispanic Black |
| Non-Hispanic American Indian/Alaskan Native (AI/AN) |
| Non-Hispanic Asian (includes Native Hawaiians and Pacific Islanders) |
| Non-Hispanic, Another Race |
| Non-Hispanic, Unknown or Missing Race |
Race/Ethnicity by Data Source
Death Certificate Data
- Race and ethnicity are included across all years of death certificate data.
- Race and ethnicity are captured separately.
- The death certificate form allows multiple races to be selected for a single person.
- One person can be identified within multiple racial groups.
Ethnicity Considerations
Considerations apply to IVPB race/ethnicity categories across all data sources.
- Assigning ethnicity first, regardless of race, groups people together that may have very different experiences based on their race.
- For example, the Hispanic category includes both:
- People who are Black and Hispanic that may be perceived by others as Black.
- People who are white and Hispanic and may be perceived by others as white.
Race and ethnicity information from the death certificate is combined.
- Ethnicity is assigned first.
- People of Hispanic ethnicity are placed into the Hispanic category.
- This includes all Hispanic people, regardless of their race.
- Unknown or missing ethnicity is coded as non-Hispanic.
- If ethnicity is unknown or missing but race is known, the person is placed into one of the non-Hispanic racial groups.
- Non-Hispanic people are then classified into racial groups (White, Black, AI/AN, Asian, Another Race, Unknown)
- IVPB combines the following races from the death certificate data into the Asian group:
- Asian Indian
- Chinese
- Filipino
- Japanese
- Korean
- Vietnamese
- Other Asian
- Native Hawaiian
- Guamanian or Chamorro
- Samoan
- Other Pacific Islander
If someone is of multiple races, they are placed into a single racial group in the following order: AI/AN, Asian, Black, and then White.
- Races are categorized in this order to help identify as many people as possible in underrepresented groups (smaller populations).
- IVPB made this change to how people of multiple races are grouped in July 2021.
- This change was applied to historical data from before 2021 so that data for people of multiple races would be consistent across years.
- Data IVPB shared from before July 2021 included people of multiple races in an “Other” race category.
Below are examples of how race and ethnicity are grouped by IVPB in the death certificate data.
| Information from the Death Certificate | IVPB Race/Ethnicity Categories |
|---|---|
| Non-Hispanic, AI/AN, and White | Non-Hispanic AI/AN |
| Hispanic, AI/AN | Hispanic |
| Non-Hispanic, White | Non-Hispanic White |
| Non-Hispanic, Black, and White | Non-Hispanic Black |
| Non-Hispanic, Asian, and AI/AN | Non-Hispanic AI/AN |
| Unknown Ethnicity, Black | Non-Hispanic Black |
| Non-Hispanic, Unknown Race | Non-Hispanic Unknown |
While IVPB’s approach to grouping individuals of multiple races into a single race category in the death certificate data helps ensure there is representation in smaller groups, it can prevent the ability to identify important differences in populations.
- For example:
- Someone who is AI/AN and Asian would be placed in the AI/AN group, which may make it difficult to understand differences across subgroups within the Asian category.
- Someone who is Black and Asian would be grouped in the Asian category and may have different experiences than someone who is Asian alone.
- IVPB may sometimes group multiple races differently than outlined above when using death certificate data for CDC reporting, special projects, or other analyses.
- For death certificates, race and ethnicity are normally collected from the decedent’s next-of-kin (spouse, parent, child, other relative or other knowledgeable person).
- In cases where there is not an available next-of-kin or knowledgeable person to share this information, race and ethnicity may be assigned by a physician or medical examiner. This may result in misclassification of race and ethnicity.
To learn more about death certificate data, visit Data Sources IVPB Uses for Injury Surveillance.
Hospital Discharge Data (HDD)
- Race and ethnicity are available in the HDD starting in 2014.
- Race and ethnicity information is captured separately.
- Only one race is assigned to each person.
The race and ethnicity information in the HDD is combined into a single category.
- Ethnicity is assigned first.
- People of Hispanic ethnicity are placed into the Hispanic category.
- This includes all Hispanic people, regardless of their race.
- Unknown or missing ethnicity is coded as non-Hispanic
- If ethnicity is unknown or missing but race is known, the person is placed into one of the non-Hispanic racial groups.
- Non-Hispanic people are then classified into racial groups (White, Black, AI/AN, Asian, Another Race, Unknown).
- Hawaiian and Pacific Islanders are grouped into the Asian category.
The table below shows how the HDD race and ethnicity categories are re-grouped by IVPB.
| HDD Race Categories | IVPB Race/Ethnicity Categories* |
|---|---|
| AI/AN | Non-Hispanic AI/AN* |
| Asian | Non-Hispanic Asian* |
| Native Hawaiian/Pacific Islander | Non-Hispanic Asian* |
| Black/African American | Non-Hispanic Black* |
| White | Non-Hispanic White* |
| Other, Non-White | Non-Hispanic Other* |
| Patient Declined/Unavailable | Non-Hispanic Unknown* |
| HDD Ethnicity Categories | IVPB Race/Ethnicity Categories* |
|---|---|
| Hispanic | Hispanic |
| Non-Hispanic | Assigned to a category based on race (see above) |
| Unknown or Missing Ethnicity |
Below are examples of how race and ethnicity are grouped by IVPB in the HDD.
| Information from the HDD | IVPB Race/Ethnicity Category |
|---|---|
| Non-Hispanic, AI/AN | Non-Hispanic AI/AN |
| Hispanic, AI/AN | Hispanic |
- In some cases, race and ethnicity may not be self-reported and may instead be assigned based on someone’s name and/or their appearance.
- This is especially true if the person was unresponsive upon admission to the hospital.
- This can result in misclassification of race and ethnicity in the HDD.
To learn more about HDD, visit Data Sources IVPB Uses for Injury Surveillance.
Emergency Department (ED) Visit Data from North Carolina Disease Event Tracking and Epidemiologic Collection Tool (NC DETECT)
ED visit data from NC DETECT first included race and ethnicity in 2016.
- The first year of data on race/ethnicity is incomplete. Data from 2017 forward are used.
- Race and ethnicity information is captured separately.
- Only one race is assigned to each person in NC DETECT.
- Multiple races are collected in the ED, but if more than one race is captured in a record the race is reported as “Other” to NC DETECT.
Race and ethnicity information is combined into a single category.
- Ethnicity is assigned first.
- People of Hispanic ethnicity are placed into the Hispanic category.
- This includes all Hispanic people, regardless of their race.
- Unknown or missing ethnicity is coded as non-Hispanic
- If ethnicity is unknown or missing but race is known, the person is placed into one of the non-Hispanic racial groups.
- Non-Hispanic people are then classified into racial groups (White, Black, AI/AN, Asian, Another Race, Unknown).
- The racial groups in NC DETECT ED Visit data align with the IVPB racial groups.
The list below shows how IVPB regroups the NC DETECT race and ethnicity categories.
* when ethnicity is non-Hispanic or unknown/missing
- Non-Hispanic AI/AN*
- American Indian
- AI/AN or American Indian
- Mexican American Indian
- Cherokee
- Alaska Indian
- American Indian
- Non-Hispanic Asian
- Asian
- Asian
- Asian Indian
- Burmese
- Cambodian
- Chinese
- Filipino
- Hmong
- Japanese
- Korean
- Laotian
- Pakistani
- Thai
- Vietnamese
- Nepalese
- Pacific Islander
- Samoan
- Guamanian or Chamorro
- Asian
- Non-Hispanic Black
- Black
- Black or African American
- African
- Liberian
- Nigerian
- Haitian
- Jamaican
- West Indian
- Black
- Non-Hispanic White
- White
- European
- English
- French
- German
- Italian
- Polish
- Middle Eastern or North African
- Egyptian
- Iranian
- Arab
- White
- Other
- Multi-race
- Other
- Unknown
- Unknown/missing
- Hispanic Latino
- Unknown/missing
- Unknown/missing
| ED Visit Data Ethnicity Categories | IVPB Race/Ethnicity Categories* |
|---|---|
| Hispanic | Hispanic |
| Non-Hispanic | Assigned to a category based on race (see above) |
| Unknown or Missing Ethnicity |
Below are examples of how race and ethnicity are grouped by IVPB in the ED visit data.
| Information from the ED Visit Data | IVPB Race/Ethnicity Category |
|---|---|
| Non-Hispanic, AI/AN | Non-Hispanic AI/AN |
| Hispanic, AI/AN | Hispanic |
- In some cases, race and ethnicity may not be self-reported and may instead be assigned based on someone’s name and/or their appearance.
- This is especially true if the person was unresponsive upon arrival to the ED.
- This can result in misclassification of race and ethnicity in the ED visit data.
To learn more about ED visit data, visit Data Sources IVPB Uses for Injury Surveillance.
NC Violent Death Reporting System (NC-VDRS)
NC-VDRS race/ethnicity is processed the same way as it is for death certificate data since death certificate data are one of the main sources for NC-VDRS.
- If race and ethnicity are documented differently for the same person across the data sources that feed into NC-VDRS (death certificate data, medical examiner data, and law enforcement reports), abstractors use the race and ethnicity listed on the death certificate.
To learn more about NC-VDRS data, visit Data Sources IVPB Uses for Injury Surveillance.
NC State Unintentional Drug Overdose Reporting System (NC-SUDORS)
NC-SUDORS race/ethnicity is processed the same way as it is for death certificate data since death certificate data are one of the main sources for NC-SUDORS.
- If race and ethnicity are documented differently for the same person in the medical examiner data than it is in the death certificate data, abstractors use the race and ethnicity listed on the death certificate.
To learn more about NC-SUDORS data, visit Data Sources IVPB Uses for Injury Surveillance.
Population Data
IVPB receives a specialty file with estimates of the NC resident population annually.
This file is created by the National Center for Health Statistics (NCHS) using the U.S. Census Bureau data and shared with the NCDHHS Division of Public Health.
- These estimates are used as the denominator to calculate rates of injury in NC by race/ethnicity and other demographic groups.
Race and ethnicity information is combined into a single category.
- Population data do not include estimates for unknown race or ethnicity.
- Everyone is assigned to one of the included race and ethnicity categories.
- Ethnicity is assigned first.
- People of Hispanic ethnicity are placed into the Hispanic category.
- This includes all Hispanic people, regardless of their race.
- Non-Hispanic people are then classified into racial groups (White, Black, AI/AN, Asian, Multi-Race)
- IVPB includes Hawaiian and Pacific Islanders in the Asian category.
- Categories for race alone or in combination are not currently being used by IVPB.
- Since there is not a multi-race category in the other datasets IVPB uses, the multi-race group in the population data currently is not used when calculating rates of injury by race/ethnicity.
- The multi-race category is included in IVPB rate calculations for the state or a county as a whole.
The table below shows how race and ethnicity in the population data are re-grouped by IVPB.
The table below shows how race and ethnicity in the population data are re-grouped by IVPB.
| HDD Race Categories | IVPB Race/Ethnicity Categories* |
|---|---|
| American Indian/Alaskan Native Alone | Non-Hispanic AI/AN* |
| Asian Alone | Non-Hispanic Asian* |
| Hawaiian/Pacific Islander Alone | |
| Black Alone | Non-Hispanic Black* |
| White Alone | Non-Hispanic White* |
| Two or More Races (Multi-Race) | Non-Hispanic Multi-Race* |
| White Alone or in Combination | Not currently being used by IVPB |
| Asian Alone or in Combination | |
| Native Hawaiian and Other Pacific Islander Alone or in Combination | |
| Black Alone or in Combination | |
| White Alone or in Combination |
| Population Data Ethnicity Categories | IVPB Race/Ethnicity Categories* |
|---|---|
| Hispanic | Hispanic |
| Non-Hispanic | Assigned to a category based on race (see above) |
Below are examples of how race and ethnicity are grouped by IVPB in the population data.
| Population Data | IVPB Race/Ethnicity Category |
|---|---|
| Non-Hispanic, AI/AN, Black | Non-Hispanic Multi-Race |
| Hispanic, AI/AN | Hispanic |
| Non-Hispanic, Hawaiian/Pacific Islander | Non-Hispanic Asian |
To learn more about population data, visit Data Sources IVPB Uses for Injury Surveillance.
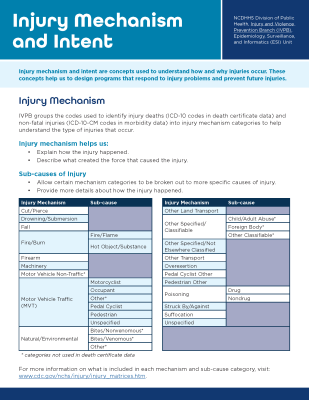
Injury mechanism and intent are concepts used to understand how and why injuries occur. These concepts help us to design programs that respond to injury problems and prevent future injuries.
Injury Mechanism
IVPB groups the codes used to identify injury deaths (ICD-10 codes in death certificate data) and non-fatal injuries (ICD-10-CM codes in morbidity data) into injury mechanism categories to help understand the type of injuries that occur.
Injury mechanism helps us:
- Explain how the injury happened.
- Describe what created the force that caused the injury.
Sub-causes of Injury
- Allow certain mechanism categories to be broken out to more specific causes of injury.
- Provide more details about how the injury happened.
Injury mechanisms and sub-causes:
- Cut/Pierce
- Drowning/Submersion
- Fall
- Fire/Burn
- Fire/Flame
- Hot Object/Surface
- Firearm
- Machinery
- Motor Vehicle Non-Traffic*
- Motor Vehicle Traffic (MVT)
- Motorcyclist
- Occupant
- Other*
- Pedal Cyclist
- Pedestrian
- Unspecified
- Natural/Environmental
- Bites/Nonvenomous*
- Bites/Venomous*
- Other*
- Other Land Transport
- Other Specified/Classifiable
- Child/Adult Abuse*
- Foreign Body*
- Other Classifiable*
- Other Specified/Not Elsewhere Classified
- Other Transport
- Overexertion
- Pedal Cyclist Other
- Pedestrian Other
- Poisoning
- Drug
- Nondrug
- Suffocation
- Unspecified
*Categories not used in death certificate data
More information on what's included in each mechanism and sub-cause category
Injury Intent
Injury intent helps us:
- Describe why an injury happened
- Explain if the injury happened on purpose (intentional) or not (unintentional)
| Injury Intent | Sub-cause |
|---|---|
| Unintentional | These are injuries that did not happen on purpose, including if someone hurts themselves or if they hurt someone else by mistake1. Unintentional injuries are sometimes called accidents. |
| Intentional: Self-Inflicted/Suicide | These are injuries that happen when a person hurts themselves on purpose. Self-inflicted injuries include suicide deaths, suicide attempts and injuries from self-harm. |
| Intentional: Assault/Homicide | These are injuries that happen when someone uses force to hurt another person on purpose1. Assault includes things like fighting, hitting or using weapons to cause harm or death. |
| Intentional: Legal Intervention | These are injuries caused by police or other law enforcement officers while doing their jobs. This can include government-approved executions1. This category does not mean the actions were legal or illegal from a criminal justice perspective. Some systems define legal intervention differently. For example, NC Violent Death Reporting System excludes legal executions, assisted suicides and deaths from war. Other systems may include some or all of these deaths. |
| Undetermined | These are injuries where it is not clear if the injury happened on purpose or not. |
Using Mechanism and Intent Together
Together, injury mechanism and intent help us to monitor different types of injuries and understand their causes to inform injury-specific prevention strategies.
| Example Injury Mechanisms and Intents | Unintentional (Unint.) | Self-Inflicted/Suicide | Assault/Homicide | Undetermined (Undet.) | All Injury Intents |
|---|---|---|---|---|---|
| Motor Vehicle Traffic (MVT) | Unint. MVT | Self-Inflicted MVT | MVT Assault | Undet. MVT | Total MVT |
| Falls | Unint. Falls | Self-Inflicted Falls | Fall Assault | Undet. Falls | Total Falls |
| Firearm | Unint. Firearm | Self-Inflicted Firearm | Firearm Assault | Undet. Firearm | Total Firearm |
| Drowning | Unint. Drowning | Self-Inflicted Drowning | Drowning Assault | Undet. Drowning | Total Drowning |
| Drug Poisoning | Unint. Drug Poisoning | Self-Inflicted Drug Poisoning | Drug Poisoning Assault | Undet. Drug Poisoning | Total Drug Poisoning |
| All Injury Mechanisms | Total Unint. | Total Self-Inflicted | Total Assault | Total Undet. | Total Injuries |
For more information on injury mechanism and intent and the codes used to identify injuries, visit NCHS - ICD Injury Codes and Matrices and NCHS - Injury Tools and Frameworks.
What Is a Case Definition?
A case definition is a set of rules used to determine what counts when identifying cases of a certain health problem, like injuries.
Case definitions:
- Provide consistency in data by outlining what should and should not be included.
- Ensure injuries or other health events are counted the same way in different places and overtime.
- This allows data for different groups or places to be compared.
- Allow us to know when there are meaningful changes in the data.
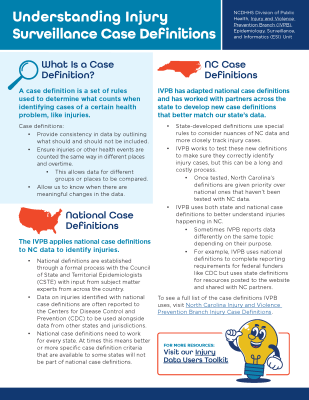
National Case Definitions
The IVPB applies national case definitions to NC data to identify injuries.
- National definitions are established through a formal process with the Council of State and Territorial Epidemiologists (CSTE) with input from subject matter experts from across the country.
- Data on injuries identified with national case definitions are often reported to the Centers for Disease Control and Prevention (CDC) to be used alongside data from other states and jurisdictions.
- National case definitions need to work for every state. At times, this means better or more specific case definition criteria that are available to some states will not be part of national case definitions.
NC Case Definitions
IVPB has adapted national case definitions and has worked with partners across the state to develop new case definitions that better match our state’s data.
- State-developed definitions use special rules to consider nuances of NC data and more closely track injury cases.
- IVPB works to test these new definitions to make sure they correctly identify injury cases, but this can be a long and costly process.
- Once tested, North Carolina’s definitions are given priority over national ones that haven’t been tested with NC data.
- IVPB uses both state and national case definitions to better understand injuries happening in NC.
- Sometimes IVPB reports data differently on the same topic depending on their purpose.
- For example, IVPB uses national definitions to complete reporting requirements for federal funders like CDC but uses state definitions for resources posted to the website and shared with NC partners.
To see a full list of the case definitions IVPB uses, visit North Carolina Injury and Violence Prevention Branch Injury Case Definitions.
Common Components of an Injury Case Definition
There are elements included in each case definition to outline what should be counted as a case.
Injury case definitions have different criteria depending on the data source being used and what kind of injury or health outcome is being counted.
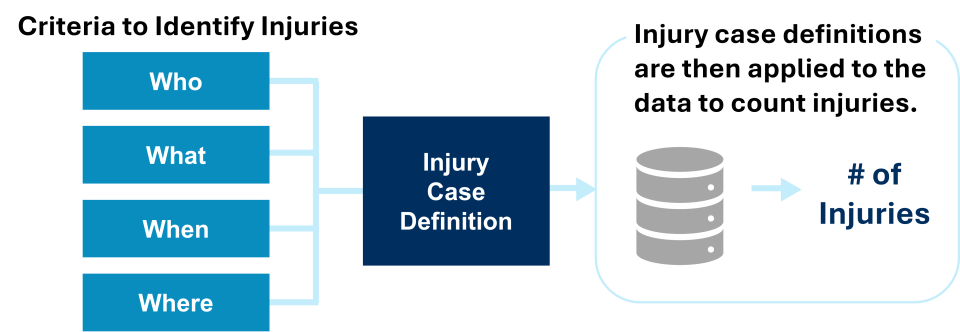
Who
- Case definitions include criteria to identify events among specific groups of people and describe characteristics people have in common.
- Most NC injury case definitions limit data to injury cases among people who are residents of NC.
- This includes people who are NC residents but were injured somewhere else.
- Most NC injury case definitions limit data to injury cases among people who are residents of NC.
- Some injury case definitions limit who is included using criteria to identify populations at increased risk of injury. For example:
- Limiting by age group – Self-inflicted injuries and suicides are limited to those ages 10 and older.
- Limiting by sex – Some intimate partner violence (IPV) case definitions limit cases to females since they are statistically more likely to experience certain forms of IPV-related injuries.
What
Case definitions include clinical criteria to identify cases of a specific health event. For injuries, these criteria depend on the type of injury and the data source being used.
Below are ways IVPB identifies injuries in surveillance data.
- Cause of Death and Diagnosis Codes
- These are codes used to group diseases and conditions within health care data sets. A particular code or ranges of codes are used to identify injury-related events in death certificate and morbidity data sets.
- Death Certificate Data – International Classification of Diseases 10 (ICD-10) is a system used to classify and code the primary and underlying causes of death.
- Morbidity Data – A coding structure based on ICD-10 coding with a clinical modification (ICD-10-CM) is used to classify diagnoses and reasons for health care visits.
- ICD-10-CM codes are intended for administrative and billing purposes, not public health surveillance. This can affect which codes are or are not assigned to a record and therefore which events are included or excluded as injury cases.
- For more information on the ICD-10 and ICD-10-CM codes used to classify injuries, visit ICD Injury Codes and Matrices (CDC) and Injury Tools and Frameworks.
- These are codes used to group diseases and conditions within health care data sets. A particular code or ranges of codes are used to identify injury-related events in death certificate and morbidity data sets.
- Keywords
- Some case definitions search for keywords or phrases in free text data fields, like medical visit notes, to help identify cases. Keyword searches can include:
- Root words, abbreviations, and misspellings to ensure the case definition captures as many relevant cases as possible
- Words to exclude, or negations, to remove records that should not be considered as a case
- Keywords are often included in syndromic surveillance case definitions.
- Syndromic surveillance uses near-real-time health data to detect and monitor public health threats.
- Syndromic surveillance case definitions search chief complaint fields and triage notes in ED visit data. Text fields like the narrative can be included in case definitions for EMS encounter data.
- These definitions can include a combination of keywords and diagnosis codes.
- Keywords are useful for identifying cases where ICD-10-CM codes may not have been assigned to the record yet or are not specific enough to define the case.
- Some case definitions search for keywords or phrases in free text data fields, like medical visit notes, to help identify cases. Keyword searches can include:
When
Case definitions limit cases to a specific timeframe.
- Most injury case definitions include cases that occurred within a calendar year.
- Case definitions can be applied to a shorter time frame (cases in the most recent month or quarter) or over multiple years.
Where
- Case definitions can include criteria to identify cases based on where they occurred.
- Most injury case definitions are restricted to NC residents no matter where they were injured.
- Some definitions identify cases among residents of a specific county or region of the state.
- Differences Between Occurrent and Resident Injuries and Deaths
- Data Among Residents – Includes all resident cases, even if the injury or death occurred in another county or state in the US.
- Limiting cases to NC residents allows us to calculate rates to better understand meaningful differences between populations.
- Data by Occurrence – Includes all injuries in a specific location, regardless of a person’s residence status.
- Counting cases based on where they happen helps us understand how they affect local hospital systems and services.
- This can also be useful for areas with lots of people coming and going, including college towns, cities or counties that are common tourist destinations, or areas with large populations of people experiencing homelessness.
- Data Among Residents – Includes all resident cases, even if the injury or death occurred in another county or state in the US.
IVPB includes different types of data and statistics in our data resources, like counts, percentages, and rates. The differences between each of these data points and why they are used are described below.
Injury Counts
Injury counts show the total number of events or injuries.
Counts are a whole number. They are also sometimes called raw numbers.
- Counts are useful to understand how many injuries happened in NC and the number of injuries among specific groups or areas in the state.
- Counts are not adjusted to account for the size of groups or the time period of the data.
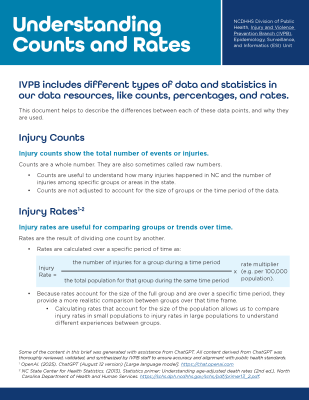
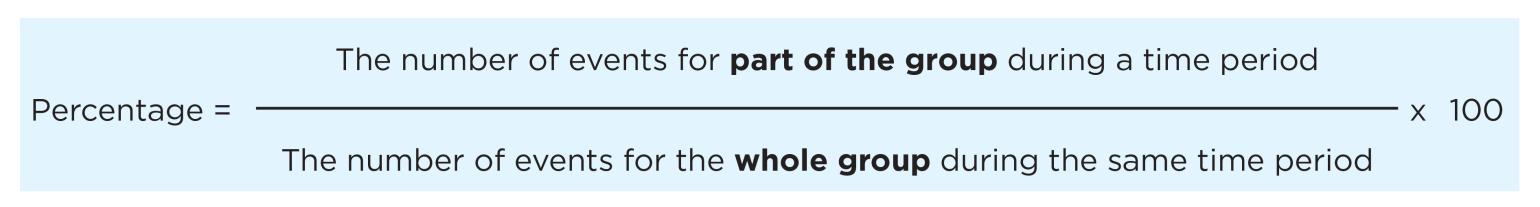
Injury Rates
Injury rates1, 2 are useful for comparing groups or trends over time.
Rates are the result of dividing one count by another and are calculated over a specific period of time as:
- Because rates account for the size of the full group and are over a specific time period, they provide a more realistic comparison between groups over that time frame.
- Calculating rates that account for the size of the population allows us to compare injury rates in small populations to injury rates in large populations to understand different experiences between groups.
- Rates often use a multiplier, like a rate per 100,000 population. Scaling the data like this makes rare events easier to see and compare.
- Without a multiplier, most rates would be very small decimal numbers.
- Using a multiplier helps to make the rate more meaningful and understandable.
Differences Between Counts and Rates
The table below shows an example of an injury rate calculation for two groups. Even though there may be more injuries in Group 1, the injury rate is higher for Group 2 because the total population for group 2 is much smaller than group 1.
| Group | Injury Count | Population | Injury/Population | Multiplier | Rate per 100,000 |
|---|---|---|---|---|---|
| Group 1 | 6 | 60,000 | 0.00010 | 100,000 | 10.0 |
| Group 2 | 4 | 30,000 | 0.00013 | 100,000 | 13.3 |
Types of Rates
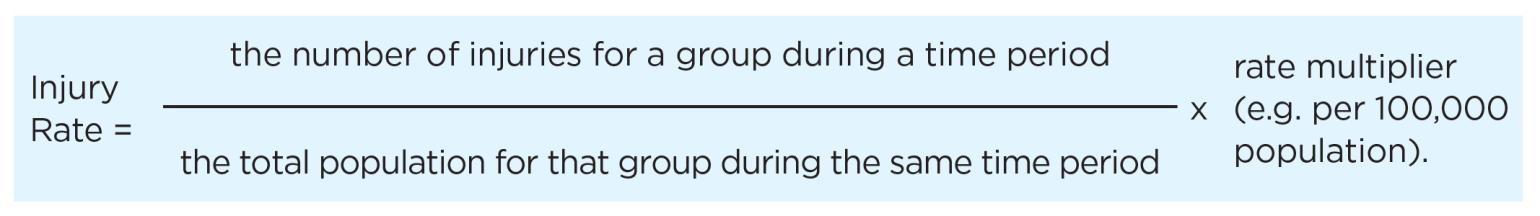
Percentages
Percentages, or proportions, compare a part of something to its whole and are a type of rate per 100.
Percentages are rates, but not all rates are percentages.
Below are some examples of how IVPB uses percentages:
- Of the 4,442 overdose deaths in 2023, 3,417, or 77%, involved fentanyl.
- 967, or 62%, of the 1,562 suicides in 2022 involved a firearm.
- 21,695, or 78%, of the 27,880 hospitalizations for fall injuries in 2023 were among adults 65 and older.
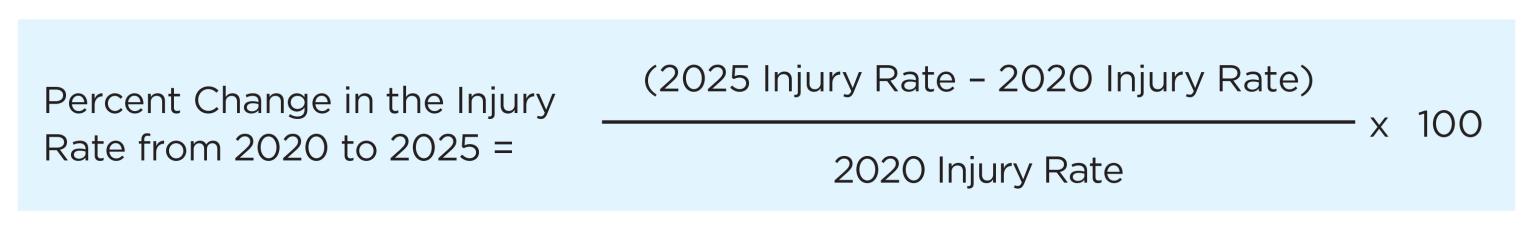
IVPB uses percent change to understand how much something has increased or decreased over time.
Percent change takes the difference of a value (percentage, count, rate, etc.) at two points in time, divided by the starting value.
For example:
- There was a 228% increase in medication and drug overdose deaths over the 10-year period of 2014-2023 (1,355 deaths in 2014 and 4,442 deaths in 2023).
- The number of emergency department (ED) visits for motor vehicle traffic injuries decreased by 2% from 124,932 ED visits in 2019 to 121,930 ED visits in 2023.
Crude Rates 1
IVPB uses crude or unadjusted rates to monitor injuries over time and compare the burden of injuries across groups.
Crude injury rates are the number of injuries that occurred divided by the population at risk of injury for a given time frame, like the rate shown in the Injury Rates section above. These are rates that have not incorporated any considerations for differences between populations.
- A crude rate is a rate that has not been adjusted.
- Crude rates do not take into account the difference in the risk of an injury between groups within the total population (see Age-Adjusted Rates below).
- IVPB calculates crude rates among specific groups, such as rates by age group, sex, and race-ethnicity.
- These group-specific rates can be compared to show differences within groups.
- For example, fall injury rates among children are much lower than fall injury rates among older adults.
- Group-specific rates help focus public health prevention on those experiencing the greatest burden, or highest rate, of injury.
- Reducing injuries among groups with the highest rates of injury will reduce the overall injury rate and help reduce disparities.
- For example, if a quarter of the 1,780 fall deaths in older adults (ages 65+) had been prevented in 2023, the overall fall death rate would be reduced from 18.5 to 14.4 per 100,000.
- These group-specific rates can be compared to show differences within groups.
- IVPB typically uses a multiplier of 100,000 when calculating crude rates of injuries.
Below are some examples of how IVPB uses crude rates:
- The overdose rate in NC in 2023 was 41.0 per 100,000, an increase from the overdose rate in 2014 (13.6 per 100,000).
- The firearm death rate in NC was higher for Non-Hispanic (NH) American Indian/Alaskan Native (26.3 per 100,000) and NH Black (25.4 per 100,000) residents than the state rate of 15.2 per 100,000 in 2022.
- Overdose death rates were lowest in Tyrell County (0.0 per 100,000) and highest in Swain County (122.2 per 100,000) in 2023.
Multi-Year Rates
Multi-year rates average data over several years to provide more stable and reliable estimates, especially when there are small numbers of injury events.
Multi-year rates are calculated using the same formula shown for calculating injury rates above.
- Rates based on small numbers can change drastically with small shifts in the number of injury events from year to year.
- IVPB does not usually calculate rates of injury when the number of injuries is greater than zero and fewer than five (1-4).
- Rates calculated when the number of observed events is between five and nine should be interpreted with caution.
- Combining data over multiple years allows rates to be calculated and compared for certain injuries, groups, or places where there are not enough injury events to calculate a single-year rate.
- For more information visit, Data Suppression and Working With Small Numbers.
Combining data over time allows IVPB to share data on more specific groups.
The example below looks at female homicide deaths by race and ethnicity in NC.
- In 2022, three NH American Indian/Alaskan Native (AI/AN) women died by homicide in NC.
- The homicide rate for NH AI/AN women is unstable and is not shared because of the small number of events for that group.
- Combining data from 2018-2022, there were 23 NH AI/AN women who died by homicide in NC.
- NH AI/AN women had the highest homicide rate compared to women of other races and ethnicities.
- IVPB could not share these data with communities if they were not combined over multiple years.
| Race/Ethnicity | Rate per 100,000 Using One Year of Data – 2022 | Rate per 100,000 Using Five Years of Data – 2018-2022 |
|---|---|---|
| NH AI/AN | Data are suppressed due to count of 1-4 | 7.9 |
| NH Asian | 0.0 | .07 |
| NH Black | 3.3 | 5.6 |
| Hispanic | 0.9 | 1.6 |
| NH White | 1.0 | 2.0 |
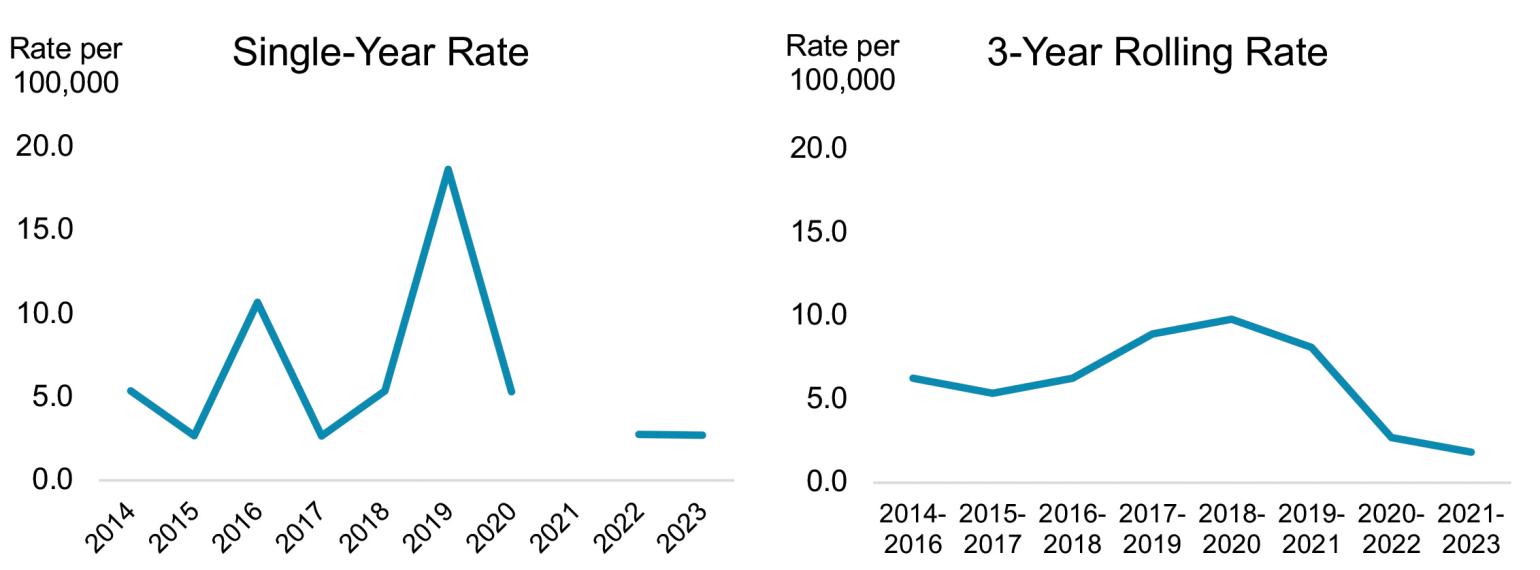
Rolling Rates 1
Rolling rates allow us to monitor trends over time when there is a small number of injury events for certain injuries, groups, or places.
- Rolling rates are multi-year rates that are calculated over time.
- Multi-year rates are calculated for the same number of years over time for multiple consecutive years.
Rolling rates typically use three to five years of data.
3-Year Rolling Rate Data Years Included 2025 3-Year Rolling Rate 2023-2025 2024 3-Year Rolling Rate 2022-2024 2023 3-Year Rolling Rate 2021-2023
- Rolling rates are used to smooth out large changes that might happen in a single year from shifts in small numbers when monitoring injury trends over time.
- Rolling rates can make data steadier over time. They can make it easier to understand and help visualize patterns.
Comparison of Single-Year and 3-Year Rolling Rates
Alexander County Homicide Rates, NC Violent Death Reporting System, 2014-2023
Age-Adjusted Rates 1, 2, 3
Age adjusting is common in public health because it lets us know that the difference in rates between two groups is not caused by differences in the ages of people within those groups.
- Age-adjusted rates are rates that have been revised to account for the differences in age distribution between groups.
- Age-adjusted rates are not the actual or true population rates. They are relative rates used specifically for making comparisons.
- Age adjusting is often used to account for the higher rates of disease and death that occur naturally among older populations as they age.
- Counties with a larger population of older adults will have higher fall injury rates than counties with a larger population of younger adults just because older adults have a higher risk of falling.
- Age-adjusting helps us make more meaningful comparisons of fall injury rates between counties with different underlying age distributions.
IVPB usually uses age-specific rates instead of age-adjusted rates for injury surveillance.
- For most injuries, older people do not have higher injury or death rates.
- Age-adjusting can make it more difficult to identify the ages most impacted by injuries and tailor prevention activities to them.
- An age-adjusted rate is one rate that accounts for age differences but doesn’t show how specific age groups differ in injury rates.
- Age-specific rates are limited to the injuries and population of a specific age group (i.e., 10 – 17-year-olds).
- Age-specific rates are a series of rates, one for each age group. Age-specific rates account for age differences and also show how specific age groups differ in injury rates.
- For example:
- Although the highest count of ED visits for self-inflicted injury in NC was among those ages 25-44, the rate was highest for those ages 10-18 in 2024.
- Females ages 10-18 had a rate of self-inflicted injury-related ED visits that was more than 3 times higher than that for males ages 10-18 (453.5 and 136.4 per 100,000, respectively) in 2024.
IVPB shares age-adjusted rates with the CDC to compare injury rates nationally and between states.
IVPB uses the direct method to calculate age-adjusted rates. This approach produces an estimate of what the rate would be if the groups within a population had the same age distribution, or the same number of people in each age group.
- Data are broken out into age groups (like <1, 1-4, 4-9, etc.).
- Age-specific death rates are calculated for each age group.
- Those age-specific rates are then applied to the age distribution for a “standard” or “control” population to calculate expected age-specific rates.
- The expected rates for each age group are added up and then divided by the total standard population to get an “expected” overall rate for that group.
- This helps to make the rate more meaningful when comparing data about one place to another.
Visit age-adjusted rates (CDC) for more information.
Understanding Age-Adjusted Rates: Falls and Homicides in 2022
The example below shows the difference between a crude rate and an age-adjusted rate across two causes of injury death, unintentional falls and homicides. It shows how age-adjustment accounts for the different age distribution among populations impacted by different causes of death.
| Rate | Unintentional Fall Deaths | Homicides |
|---|---|---|
| Crude Rate (per 100,000) | 17.2 | 8.9 |
| Age-Adjusted Rate (per 100,000) | 14.4 | 9.1 |
- The rate of unintentional fall deaths decreases after age-adjustment.
- This is because most fall deaths happen among older adults, who represent a smaller proportion of the overall population.
- The homicide rate increases after age-adjustment
- This is because most homicides happened among young to middle-aged adults, who represent the largest part of the population in NC.
The table below shows the age distribution used to calculate the age-adjusted unintentional fall deaths and homicide rates.
| Age Group | State Population | Number of Fall Deaths | Number of Homicides |
|---|---|---|---|
| <1 year | 121,554 | 0 | 4 |
| 1-4 years | 474,936 | 2 | 13 |
| 5-9 years | 623,783 | 0 | 17 |
| 10-14 years | 660,316 | 1 | 18 |
| 15-19 years | 705,170 | 0 | 96 |
| 20-24 years | 747,739 | 1 | 182 |
| 25-34 years | 1,437,479 | 15 | 325 |
| 35-44 years | 1,351,351 | 19 | 262 |
| 45-54 years | 1,346,958 | 41 | 236 |
| 55-64 years | 1,367,808 | 144 | 254 |
| 65-74 years | 1,106,578 | 242 | 185 |
| 75-84 years | 568,271 | 567 | 132 |
| 85+ years | 187,030 | 814 | 72 |
| Total | 10,698,973 | 1,846 | 1,796 |
Years of Potential Life Lost (YPLL)
YPLL4, 5, 6 is an estimate of how long a person would have lived if they didn’t die early.
YPLL can be used to help show which types of injuries and other health problems cause people to die too soon.
Using YPLL helps to:
- Understand deaths that could have been prevented
- Identify causes of death that impact younger people
How is YPLL calculated?
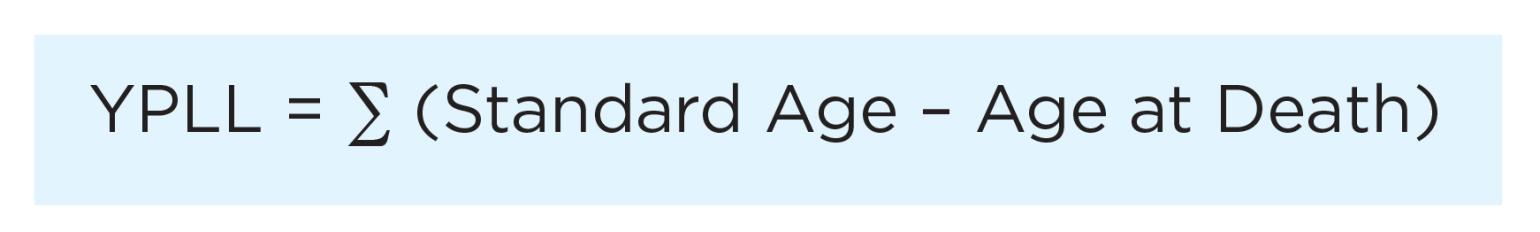
YPLL is the difference in years between the age when someone dies and the age they were expected to live to (estimated life expectancy).
- That number is then totaled for all people who died within a specific group or for a specific cause of death.
- Life expectancy is set to a standard age. This cut point can vary depending on the analysis.
- If someone died at the standard age or were older than the standard age when they died, they wouldn’t be included in the total YPLL.
For example:
Three people died from overdose in a city in NC in 2025. They were 18, 45, and 24 years old. If the standard age was set to 75, the YPLL from overdose in that city would be:
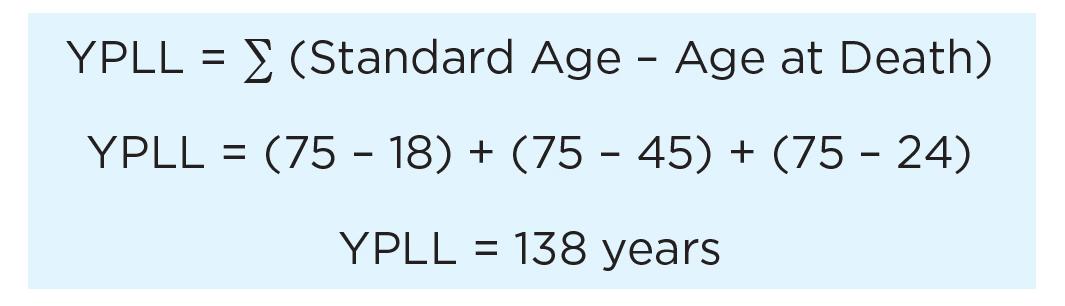
YPLL can be used as a count or a rate.
While knowing the total YPLL can be useful, it is also helpful to use YPLL with the total number of deaths for the group or cause of interest for more context when making comparisons.
- Causes of death with a higher YPLL and a lower number of deaths show that more young people are dying of that cause.
Average YPLL is a rate that considers both the YPLL and the total number of deaths.
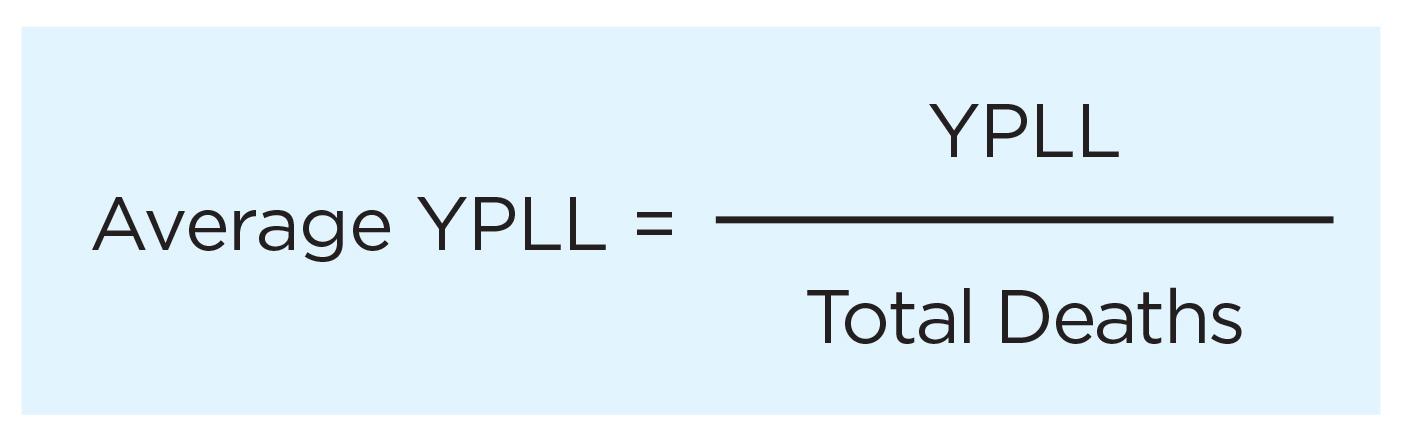
Average YPLL can help compare the impact of early death across causes of death.
- A higher average YPLL for one group indicates that group dies earlier than others for that cause of death.
YPLL can also be expressed as a rate within a population, like a crude rate.
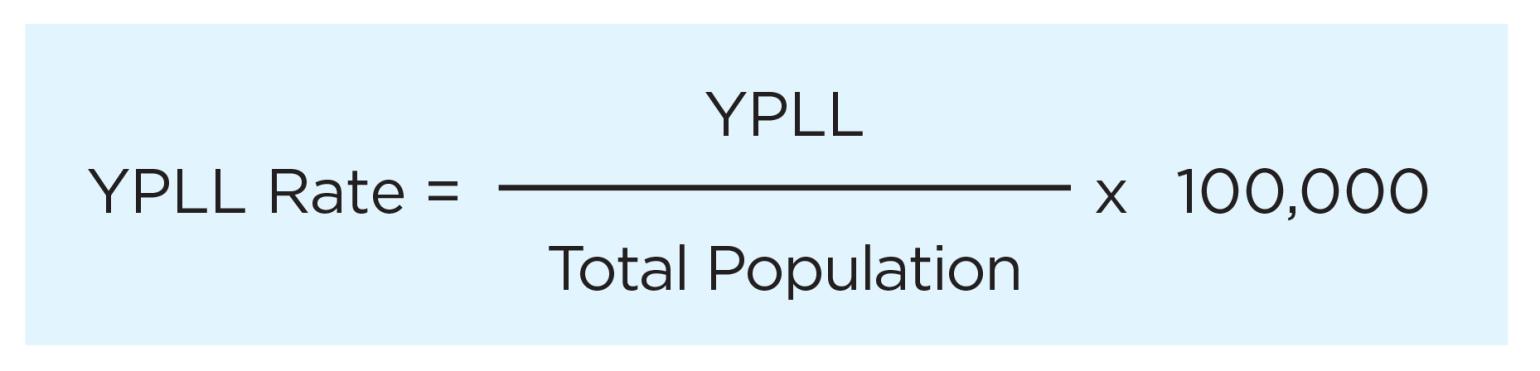
Expressing YPLL as a rate is useful when comparing YPLL across populations or groups and over time.
- A higher rate of YPLL for one group indicates that group dies earlier than others for that cause of death.
Percent of YPLL by Cause of Death
Comparing percent of YPLL for a cause of death out of the total YPLL for all causes of death can help show which causes of death contribute most to the YPLL.
- YPLL data are available on the CDC WISQARS Leading Causes of Death Visualization Tool for NC and for other jurisdictions.
Years of Potential Life Lost Before Age 65 for the Top Five Leading Causes of Death in NC in 2023.
The figure and table below show the percentage of YPLL before the age of 65 for the five leading causes of death compared to the YPLL for all causes of death in North Carolina in 2023.
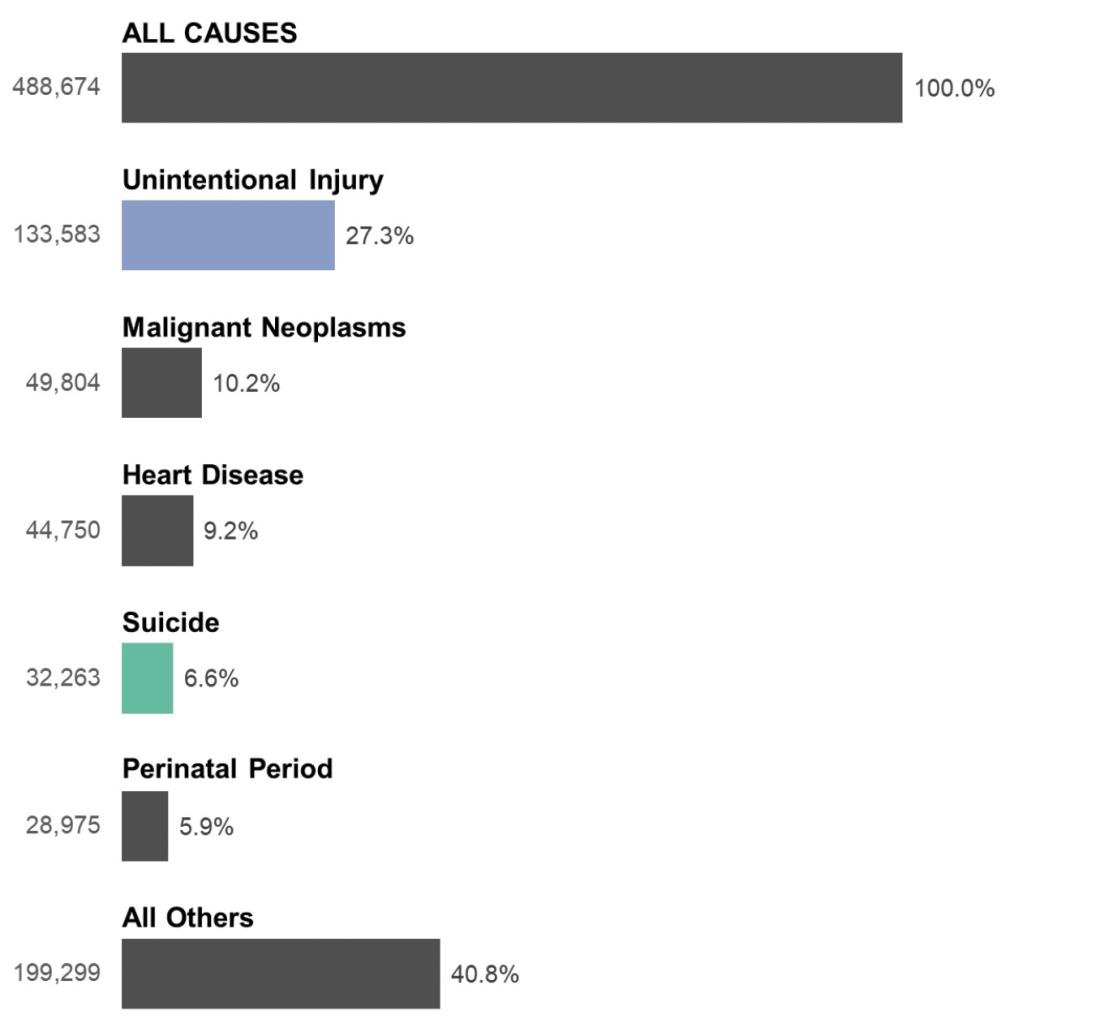
| Cause of Death | Number | Percent |
|---|---|---|
| Unintentional Injury | 133,583 | 27.3% |
| Malignant Neoplasms | 49,804 | 10.2% |
| Heart Disease | 44,750 | 9.2% |
| Suicide | 32,263 | 6.6% |
| Perinatal Period | 28,975 | 5.9% |
| All Other Causes | 199,299 | 40.8% |
| Total - All Causes | 488,674 | 100.0% |
For more information on YPLL, visit:
- 1a1b1c1d
OpenAI. (2025). ChatGPT (August 12 version) [Large language model]. https://chat.openai.com
- 2a2b
NC State Center for Health Statistics. (2013). Statistics primer: Understanding age-adjusted death rates (2nd ed.). North Carolina Department of Health and Human Services. https://schs.dph.ncdhhs.gov/schs/pdf/primer13_2.pdf.
- 3
Centers for Disease Control and Prevention. (2025, June 25). Age adjustment. National Center for Health Statistics. https://www.cdc.gov/nchs/hus/sources-definitions/age-adjustment.htm
- 4
Centers for Disease Control and Prevention. (n.d.). WISQARS glossary. National Center for Injury Prevention and Control. https://wisqars.cdc.gov/glossary/
- 5
Florida Department of Health. (n.d.). Years of potential life lost (YPLL): Description and calculation method. FLHealthCHARTS. https://www.flhealthcharts.gov/Charts/documents/YPLLDescription.pdf
- 6
North Carolina State Center for Health Statistics. (2002). SCHS-130. North Carolina Department of Health and Human Services. https://schs.dph.ncdhhs.gov/schs/pdf/schs130.pdf
What Is Data Suppression?
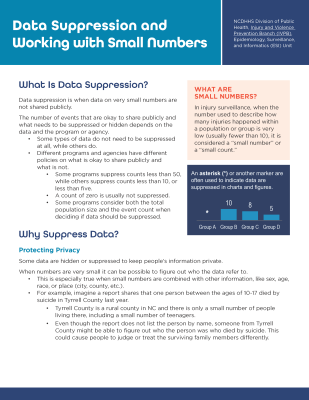
Data suppression is when data on very small numbers are not shared publicly.
The number of events that are okay to share publicly and what needs to be suppressed or hidden depends on the data and the program or agency.
- Some types of data do not need to be suppressed at all, while others do.
- Different programs and agencies have different policies on what is okay to share publicly and what is not.
- Some programs suppress counts less than 50, while others suppress counts less than 10, or less than five.
- A count of zero is usually not suppressed.
- Some programs consider both the total population size and the event count when deciding if data should be suppressed.
What Are Small Numbers?
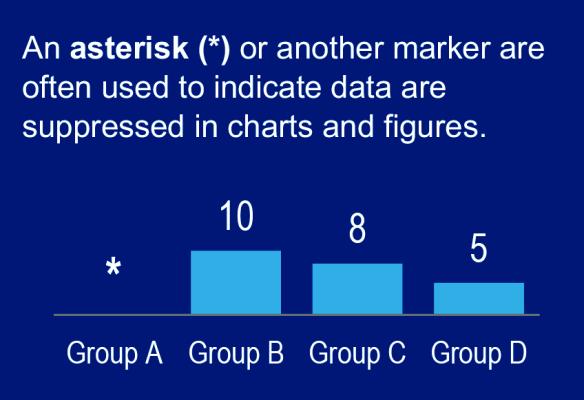
In injury surveillance, when the number used to describe how many injuries happened within a population or group is very low (usually fewer than 10), it is considered a “small number” or a “small count.”
Why Suppress Data?
Protecting Privacy
Some data are hidden or suppressed to keep people’s information private.
When numbers are very small it can be possible to figure out who the data refer to.
- This is especially true when small numbers are combined with other information, like sex, age, race, or place (city, county, etc.).
- For example, imagine a report shares that one person between the ages of 10-17 died by suicide in Tyrrell County last year.
- Tyrrell County is a rural county in NC and there is only a small number of people living there, including a small number of teenagers.
- Even though the report does not list the person by name, someone from Tyrrell County might be able to figure out who the person was who died by suicide. This could cause people to judge or treat the surviving family members differently.
Data Reliability
Statistics, like rates and percentages, that are calculated using small numbers can be unstable, or less reliable.
With small numbers, a very small change can make a big impact on a count or a rate.
- Rates can go up or down a lot, even if only one case is added or taken away.
- This makes it hard to tell if a change was caused by something real happening or if it was random.
- It is important to be careful when interpreting trends or when making decisions based on small numbers.
- You want to be sure a change is caused by a shift in overall trends and not just caused by chance.
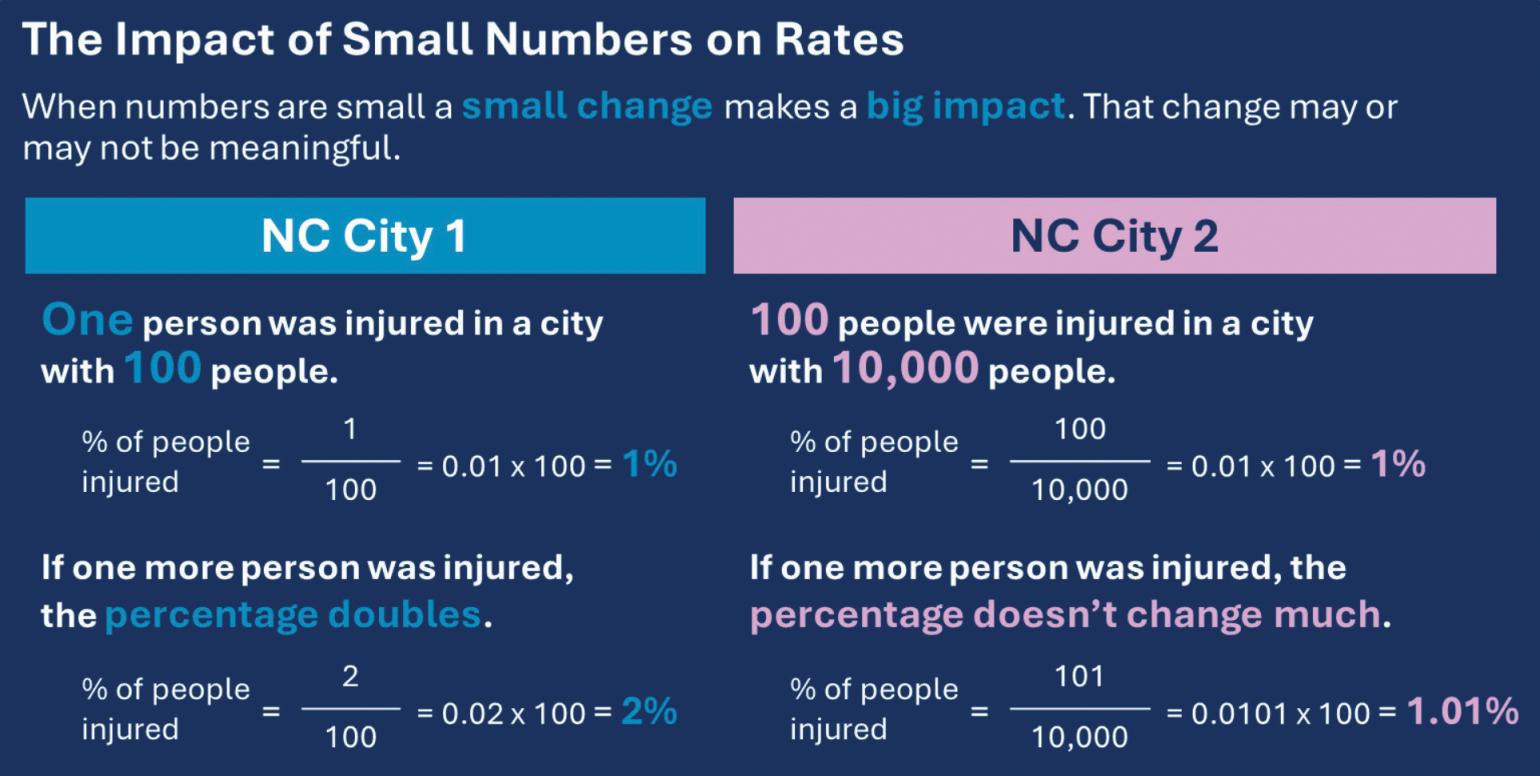
How Does IVPB Suppress Data?
IVPB believes in being open and honest about the data it collects and uses (data transparency). The Branch shares as much data as it can, while also keeping people’s private information safe.
Counts
IVPB suppresses the number of injuries differently for different data sources.
Death Data: In NC, Vital Statistics death certificate data are available publicly. Because of this, IVPB does not suppress the number of injury deaths, even when counts are very small.
- Small counts are not suppressed when using data from the NC State Unintentional Drug Overdose Reporting System (NC-SUDORS) and the NC Violent Death Reporting System (NC-VDRS), since both systems use death certificate data.
Non-Fatal Data
IVPB follows the suppression guidelines outlined by North Carolina Disease Event Tracking and Epidemiologic Collection Tool (NC DETECT) when using emergency department (ED) visit and hospital discharge data.
- In addition to the number of injuries, these guidelines also consider the size of the population and therefore, the chance that someone could be identified from the data.
Non-fatal data are suppressed when:
The number of injuries is greater than zero and less than five (1-4 injuries)
and
- Data are for a county or region
- Time frame of data is less than one year
- There were fewer than 500 total ED visits in that same county or region
or
- Data are broken out by demographic group (sex, race, etc.)
- Any time frame of data
- There were fewer than 500 total ED visits among that same demographic group
For example (these examples use fictional data):
- There were 6 hospitalizations in Watauga County in May 2022 – Not suppressed
- There were 2 ED visits for drowning-related injuries among adults ages 65-69 between 2023 and 2025, and 4,400 total ED visits for those ages 65-69 – Not suppressed
- There were 3 ED visits for motor vehicle traffic injuries in Hyde County in January 2024, and 450 total ED visits for the county that month – Suppressed
- There were 4 hospitalizations for pedestrian injuries in NC in February 2025 – Not Suppressed
Rates
IVPB does not usually calculate rates of injury when the number of injuries is greater than zero and fewer than five (1-4). This is because these numbers are too small to give reliable results.
- Rates are usually calculated when the number of observed events is between five and nine, but should be interpreted with caution.
- If the number of events observed is zero, a rate is calculated (which also equals zero) and shared.
Disaggregating Data
Disaggregating data is when data are separated into smaller parts to better understand differences between groups within the data. IVPB regularly breaks out data by things like sex, age, race/ethnicity, and county of residence.
- This helps identify patterns that might be missed when looking at the data all together.
- IVPB shares disaggregated data to inform injury prevention planning.
- These data can be used to ensure prevention strategies align with what injuries are happening, where they are happening, and to whom.
For example:
- The homicide rate in NC in 2022 was 8.6 per 100,000.
- After disaggregating data, you can see some groups have higher rates than others.
- The homicide rates for males, non-Hispanic (NH) Black, and NH American Indian residents are all higher than the state rate.
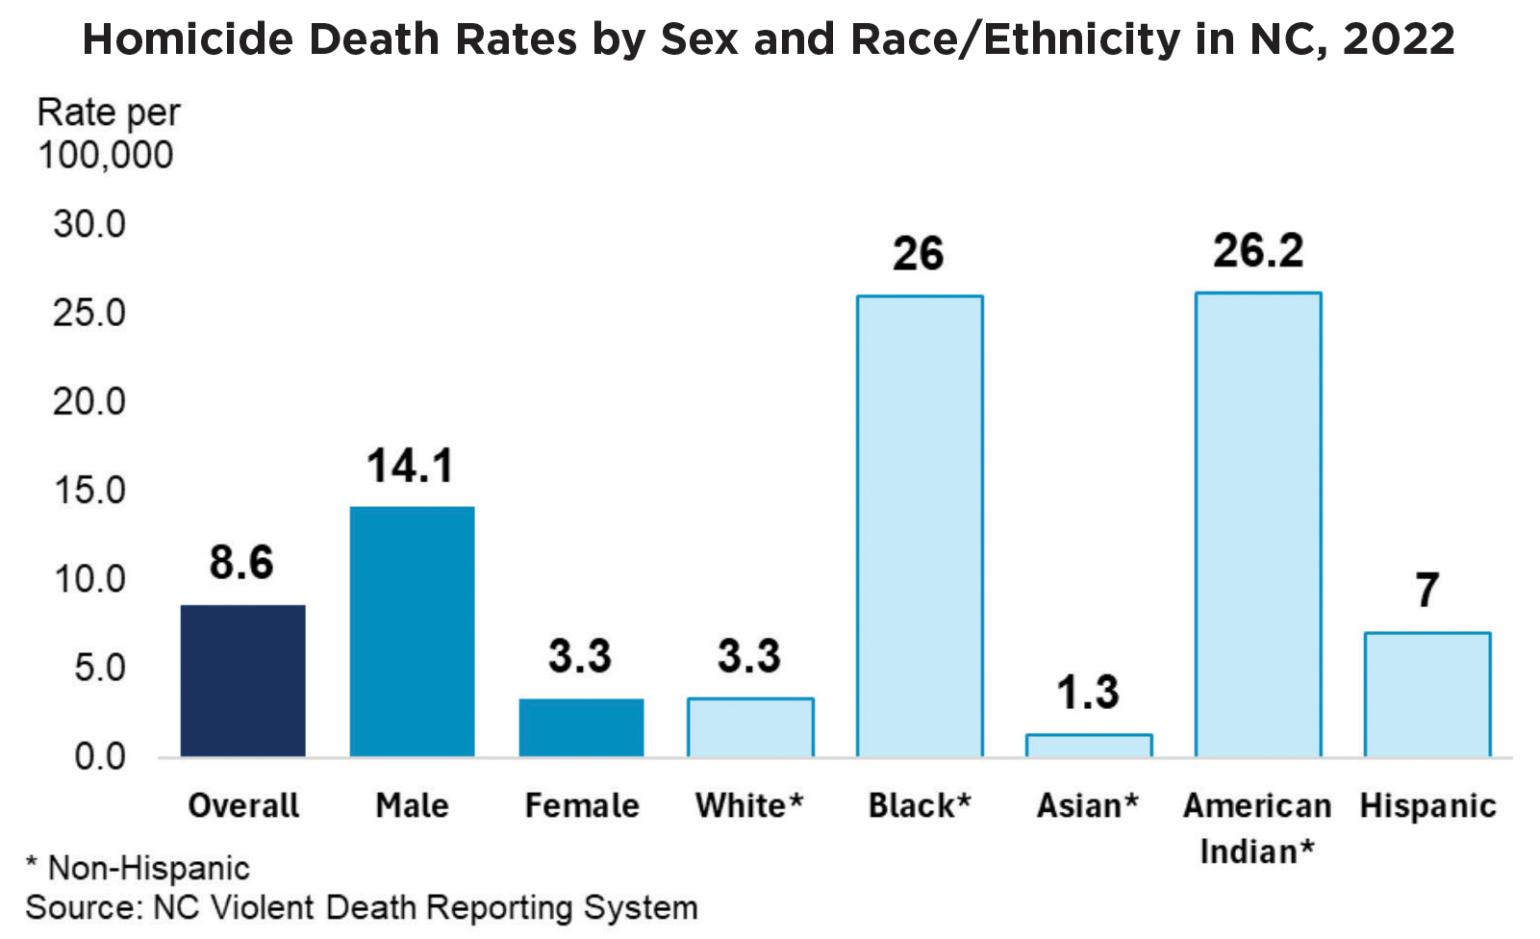
Disaggregating data can cause small numbers.
The more you break data into specific groups, like by both race and sex together, the smaller the numbers you are working with can get.
- To publicly share data for these specific groups, even when there are small numbers, IVPB often combines or aggregates data over multiple years, calculating multi-year rates.
- Combining data over several years helps increase the number of injuries included so the data can be shared for a more specific group or population.
Multi-year rates that are calculated over time (rolling rates) can be used to help interpret trends when there is a small number of injury events.- For more information on multi-year rates and rolling rates, visit Understanding Counts and Rates.
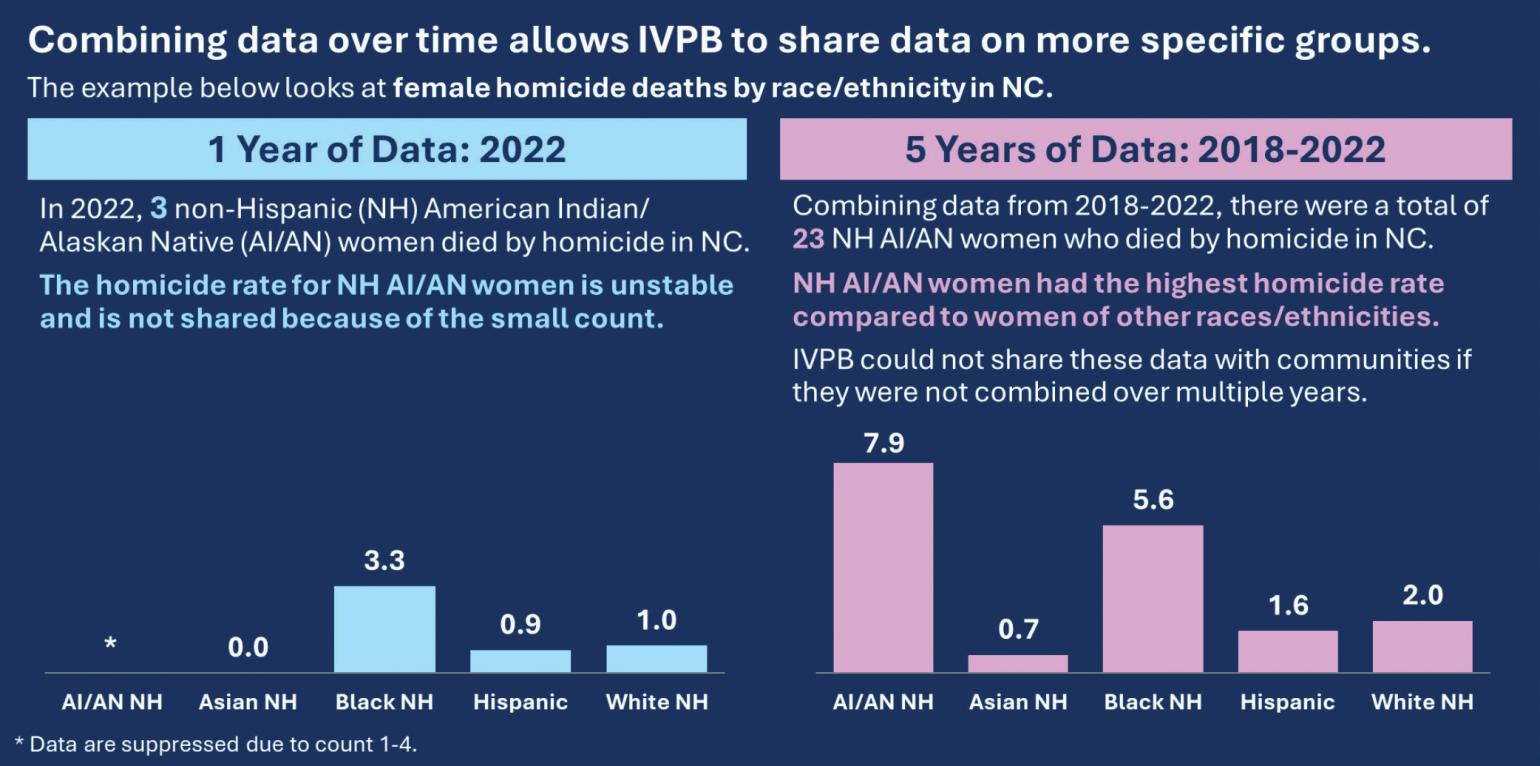
If you have any questions about injury rates shared by IVPB, contact:
- SubstanceUseData@dhhs.nc.gov for questions related to overdose, substance use, and alcohol.
- InjuryData@dhhs.nc.gov for all other injury-related questions.
Questions?
If you have questions after reviewing these resources, visit the IVPB Data Request Policy and Procedure page for information on how to contact an IVPB epidemiologist.