North Carolina Alcohol and Related Harms Data
Jump to: Alcohol Use | Alcohol-Related Harms | Alcohol Environment | Access to Care | Interactive Alcohol Data | Other Resources
This site focuses on data on excessive alcohol use and its related harms. For more information on general information and prevention strategies to reduce excessive alcohol use and its related harms, please see the North Carolina Alcohol Use and Related Harms Prevention webpage.
People tend to drink more when alcohol is available, accessible, and inexpensive.1 When people drink too much alcohol, it leads to injuries, illnesses, and death. Alcohol use can also lead to community problems, like crime and violence.2 North Carolina has a lower percentage of adults who drink, binge drink, and heavily drink when compared to the rest of the United States.3 However, North Carolina communities still experience many significant harms due to alcohol.
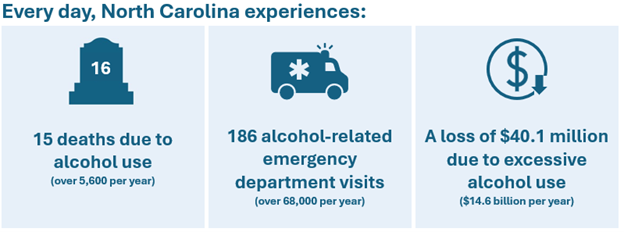
In 2024, North Carolina experienced more than 5,600 deaths and 68,000 emergency department visits due to alcohol use.4,5 North Carolina is also estimated to have lost $14.6 billion in productivity due to alcohol use.6 These 2024 data points show some of the highest alcohol-related harms to date in North Carolina’s communities when compared to previous years. To learn more, see the Interactive Alcohol Data Dashboard at the bottom of this page.
The North Carolina Injury and Violence Prevention Branch (IVPB) monitors data related to alcohol use, alcohol-related harms, and the alcohol environment to keep track of the impact of alcohol on North Carolina communities. This site provides statewide summary data as well as interactive visuals of state and county-level metrics. These data can be used by people and organizations across the state to understand the impacts of alcohol use in their communities.
Alcohol Use
No amount of alcohol is safe for health.
Each alcoholic beverage can increase the risk of alcohol-related harms. To reduce alcohol-related harms, national guidelines recommend:
- If you do not drink alcohol, do not start. Alcohol use offers no health benefits and carries risk.
- Cut back if you do drink alcohol. Each drink increases the risk of harm, including cancer, heart disease, and early death.
- Avoid alcohol if you:
- Are pregnant,
- Are under 21 years old,
- Are in recovery,
- Have certain health conditions,
- Have a family history of alcohol-related cancers, or
- Use any medications or drugs that interact with alcohol.
For adults 21 and older who choose to drink, drinking less alcohol is always better.7
Harms due to alcohol use can start at low levels of alcohol use. However, many of the alcohol-related harms shown throughout this page are due to excessive alcohol use.
Excessive alcohol use includes four types of drinking that can lead to increased risk of alcohol-related harms.
- Binge drinking: Four or more drinks for women, or five or more drinks for men during one occasion
- Heavy drinking: Eight or more drinks for women, or 15 or more drinks for men during a week
- Underage drinking: Any alcohol use by people under the age of 21
- Drinking while pregnant: Any alcohol use during pregnancy2
Excessive alcohol use is not the same as being dependent on alcohol or having alcohol use disorder. Nine out of 10 people who excessively drink alcohol are not dependent on alcohol.8
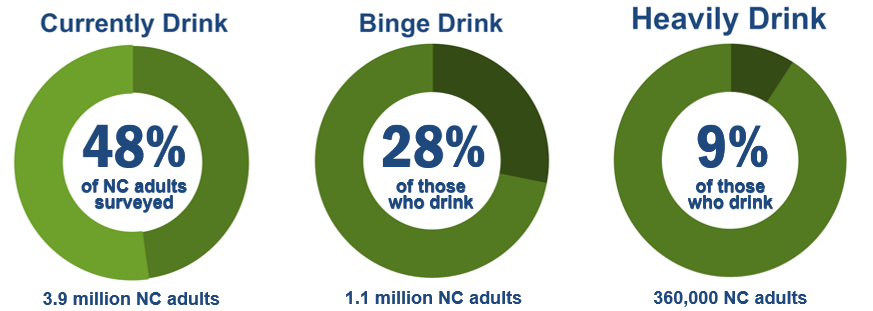
Adult Alcohol Use
Nearly 1 in 2 adults (21+ years old) in North Carolina drink alcohol, approximately 3.9 million adults. Of those who drink, 1 in 4 adults binge drink, and 1 in 10 adults drink heavily.3
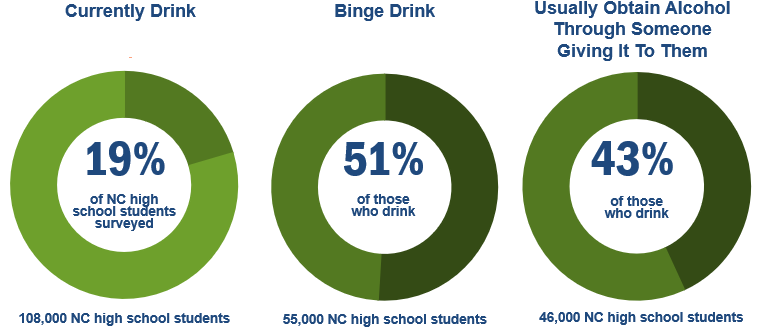
Youth Alcohol Use
Alcohol-Related Harms
Excessive alcohol use can have both immediate and long-term health risks.
Drinking excessively on occasion can lead to significant negative health impacts, such as motor vehicle crashes, homicide, violence, and other injuries.2 There were 1,788 preventable deaths of NC residents due to immediate health impacts of alcohol use in 2024.4,10
Drinking alcohol over time can also lead to significant negative health outcomes, including cancer, high blood pressure, stroke, heart disease, and many other chronic diseases.2 There were 3,820 preventable deaths of NC residents due to long-term health impacts of alcohol use in 2024.4,10
In addition, drinking alcohol contributes to negative community and personal impacts. Alcohol use contributes to poor mental health, challenges with relationships, and negative impacts on the community, including increased crime.2
Alcohol-Attributable Deaths
There are 58 causes of death associated with alcohol use. These causes of death can be due to both immediate and long-term alcohol use.10
Alcohol-Related ED Visits
Alcohol-related emergency department visits include visits caused by immediate impacts of alcohol use, such as alcohol intoxication, as well as long-term conditions, such as liver cirrhosis.5
Alcohol Environment
The alcohol environment can impact alcohol use and alcohol-related health outcomes. The alcohol environment includes the physical availability of alcohol, price of alcohol, type of alcoholic beverages available for purchase, and exposure to alcohol advertisements.11
Policies that regulate the alcohol environment promote the health and well-being of North Carolina communities. To learn more about the policies that protect the health of North Carolinians, please see the Reducing Excessive Alcohol Use to Build Healthier North Carolina Communities fact sheet (PDF).
Alcohol Outlet Density
Alcohol outlet density measures the physical availability of alcohol. It measures the number of places that sell alcohol in a given area and can be expressed as a count, rate per person, or rate per square mile. There are two main types of places that sell alcohol, on-premises locations and off-premises locations.12

Higher alcohol density exposes youth and adults to more alcohol retailers, more advertising, and more product options, leading to an increased likelihood of negative alcohol-related population health outcomes. For more alcohol outlet density measures, please see the Interactive Alcohol Data below.
There is no specific number for a "high" alcohol outlet density. To determine if an area has "high" or "low" density, we can compare areas with similar geography, areas with similar demographics, or the same area (e.g., a county) at different points in time.12
North Carolina currently measures alcohol outlet density in two ways, and each way gives us different information. While most places may be "high" in only one measure, some places may be "high" in both.
For example, the maps below show that some coastal counties have "high" alcohol outlet density in both measures.
Alcohol outlet density per person measures how many alcohol outlets there are for every 100,000 people who live there.12 Coastal counties have a higher number of tourists, so they often have more alcohol stores to serve visitors.
Alcohol outlet density per square mile measures how many alcohol outlets there are for every 100 square miles of land area in the county.12 Some coastal counties have a small land area, so there are more alcohol stores in a smaller space.
Alcohol Outlets Per Person
Places that have a small or fluctuating population may have a "high" alcohol outlet density per person, even when compared to places that have more alcohol outlets. This is because when there are fewer people in a geographic area, the weight of each retailer will be greater compared to the number of people. This will then show a higher alcohol outlet density.
Alcohol Outlets Per Square Mile
Places that have a lot of alcohol outlets and a small land area will have a "high" alcohol outlet density per square mile, even when compared to places with more alcohol outlets. This is because in a smaller geographic area, the weight of each additional alcohol outlet will be greater compared to a larger geographic area.
Access to Care
Alcohol use disorder is a treatable, chronic disease in which someone continues to drink alcohol despite it causing substantial personal, social, work, or health problems.13 Multiple evidence-based behavioral interventions and FDA-approved medications exist to treat alcohol use disorder.14 To learn more about medications to treat alcohol use disorder, please see the Medication for Alcohol Use Disorder (AUD) to Build Healthier North Carolina Communities Fact Sheet (PDF).
Nine out of 10 people who excessively drink do not meet the criteria for alcohol use disorder but still may benefit from professional help due to the risk of bad health outcomes.8,14 To learn more about screening, brief intervention, and referral to treatment for excessive alcohol use, please see the Have Your Clinic Screen for and Intervene on Excessive Alcohol Use to Build Healthier North Carolina Communities Fact Sheet.
Data on treatment rates for North Carolina residents with alcohol use disorder are currently unavailable. Prior estimates suggest that roughly eight in every 100 people in the U.S. with alcohol use disorder in the past year sought treatment.15 In the U.S., about one in every four people seeking treatment for alcohol use disorder reported receiving treatment with medication.14 Learn more about NCDHHS resources for finding treatment for alcohol and other substance issues.
Interactive Alcohol Data
Alcohol data included on this page are updated annually, except for annual emergency department visit rates which are updated monthly, and Youth Risk Behavior Survey (YRBS) percent rates, which are updated every two years. Maps include the most recent year of data. Data points (both rates and counts) are colored by the relative rates seen for that metric across NC and/or counties ever recorded, accounting for population differences between places.
See How to Interpret Data and Technical Notes below for more information.
The visualizations below include additional information that appear when you hover over data points in the map or graphs. You can also select a county and a metric from the drop-down menus to see different data.
Use critical thinking when comparing and interpreting rate ranks (HIGHEST, HIGH, MIDDLE, LOW, LOWEST) and colors in graphs and maps. Here are three examples:
- Some metrics have obvious good or bad directionality. For example, more alcohol-attributable deaths are always “bad.” Other measures may be more clearly “good” when they are high, like increased treatment access. Some metrics are more complex. Visits to the emergency department (ED) for alcohol-related conditions, at face-value, are not “good.” However, a higher alcohol-related ED visit rate may mean that more people were able to get lifesaving care.
- Even if a metric is ranked LOW or LOWEST, prevention programs can and should continue to lower rates of negative health outcomes. Even if rates are currently low, they may still be increasing.
- Rates that are ranked as HIGH or HIGHEST may increase over time. Rate rankings may change in the future as new data points are added that expand the ranges of LOW and HIGH.
Note: BRFSS and YRBSS data are not available at the county level.
Learn More Using These Resources
- IVPB Alcohol and Related Harms Prevention Page: Preventing excessive alcohol use and its related harms in North Carolina.
- Custom injury data request page: Request alcohol data from the Injury & Violence Prevention Branch (IVPB).
- IVPB Data Support Bookings Application: If you have questions regarding a custom data request or our available data products, please reserve a time to chat with one of our epidemiologists.
- Download statewide alcohol data (CSV) and associated data dictionary (CSV).
- Updated 06/18/26! Alcohol-Related Harms Surveillance Slides (PPTX): Information on statewide alcohol use, alcohol-related harms, and key prevention strategies. We encourage you to use these slides; they may be incorporated into your own presentations without prior permission.
- Updated 04/13/26! Alcohol and Cancer Data Slides (PPTX): Information on statewide alcohol-attributable cancer deaths as well as key prevention strategies. We encourage you to use these slides; they may be incorporated into your own presentations without prior permission.
- Updated 05/04/26! For an overview of alcohol's link to cancer, please see the Understanding the Link Between Alcohol and Cancer to Build Healthier North Carolina Communities Factsheet (PDF).
- Updated 06/18/26! Reducing Excessive Alcohol Use to Build Healthier North Carolina Communities (PDF): Provides an overview of excessive alcohol use, the evidence-based policies to reduce excessive alcohol use, and the status of those policies in NC.
Data Considerations: For important data considerations, see overall injury data technical notes (PDF) and injury metric case definitions.
Funding Disclaimer: This work is partially supported by the Centers for Disease Control and Prevention (CDC) of the U.S. Department of Health and Human Services (HHS) as part of a financial assistance award totaling $166,667. The contents are those of the author(s) and do not necessarily represent the official views of, nor an endorsement, by CDC/HHS, or the U.S. Government.
Suggested citation: NC Department of Health and Human Services Division of Public Health Injury & Violence Prevention Branch. “North Carolina Alcohol Data | Division of Public Health.” North Carolina Alcohol Data. Accessed <access date>. https://www.dph.ncdhhs.gov/programs/chronic-disease-and-injury/injury-and-violence-prevention-branch/north-carolina-alcohol-use-and-related-harms-prevention/data
- Centers for Disease Control and Prevention. 2024. Preventing Alcohol-Related Harms. Centers for Disease Control and Prevention. https://www.cdc.gov/alcohol/prevention/index.html
- Centers for Disease Control and Prevention. 2024. Alcohol Use and Your Health. Centers for Disease Control and Prevention. https://www.cdc.gov/alcohol/about-alcohol-use/index.html
- North Carolina State Center for Health Statistics. Behavioral Risk Factor Surveillance System (BRFSS) 2024 Annual Survey Results. North Carolina State Center for Health Statistics. Retrieved March 19, 2026 from https://schs.dph.ncdhhs.gov/data/brfss/survey.htm
- North Carolina State Center for Health Statistics. Statistics and Reports: Vital Statistics. North Carolina State Center for Health Statistics. Retrieved March 19, 2026 from https://schs.dph.ncdhhs.gov/data/vital.cfm
- North Carolina Disease Event Tracking and Epidemiologic Collection Tool (NC DETECT). Emergency Department Visits. Retrieved March 19, 2026 from https://ncdetect.org/
- 2024 estimates updated using methods from Gora Combs, K., Fliss, M. D., Knuth, K. B., Cox, M. E., & Trangenstein, P. J. (2022). The Societal Cost of Excessive Drinking in North Carolina, 2017. North Carolina Medical Journal, 83(3), 214–220. https://doi.org/10.18043/ncm.83.3.214
- U.S. Alcohol Policy Alliance. (2025, September 22). Alcohol Consumption Guidelines for the American People. U.S. Alcohol Policy Alliance. https://www.alcoholpolicy.org/latest/truth-over-profits-usapa-issues-alcohol-guidelines-prior-to-release-of-federal-dietary-guidelines
- Centers for Disease Control and Prevention. 2024. Data on Excessive Alcohol Use. Centers for Disease Control and Prevention. https://www.cdc.gov/alcohol/excessive-drinking-data/index.html
- North Carolina Department of Public Instruction. North Carolina 2021 Youth Risk Behavior Survey. North Carolina Department of Public Instruction. Retrieved December 18, 2024 from https://www.dpi.nc.gov/districts-schools/classroom-resources/academic-standards/programs-and-initiatives/nc-healthy-schools/nc-healthy-schools-data
- Centers for Disease Control and Prevention. Alcohol and Public Health: Alcohol-Related Disease Impact (ARDI). Centers for Disease Control and Prevention. Retrieved December 18, 2024 from https://nccd.cdc.gov/DPH_ARDI/default/default.aspx
- Greisen, C., Grossman, E. R., Siegel, M., & Sager, M. (2019). Public health and the four P’s of marketing: Alcohol as a fundamental example. Journal of Law, Medicine & Ethics, 47(S2), 51–54. https://doi.org/10.1177/1073110519857317
- Centers for Disease Control and Prevention. Guide for Measuring Alcohol Outlet Density. Atlanta, GA: Centers for Disease Control and Prevention, US Dept. of Health and Human Services; 2017.
- American Psychiatric Association. (2022). Diagnostic and statistical manual of mental disorders (5th ed., text rev.). https://doi.org/10.1176/appi.books.9780890425787
- Substance Abuse and Mental Health Services Administration. (2024). Key substance use and mental health indicators in the United States: Results from the 2023 National Survey on Drug Use and Health (HHS Publication No. PEP24-07-021, NSDUH Series H-59). Center for Behavioral Health Statistics and Quality, Substance Abuse and Mental Health Services Administration. https://www.samhsa.gov/data/report/2023-nsduh-annual-national-report
- Chen, C.M., Slater, M.E., Castle, I-J.P., and Grant, B.F. 2016. Alcohol Use and Alcohol Use Disorders in the United States: Main Findings from the 2012–2013 National Epidemiologic Survey on Alcohol and Related Conditions-III (NESARC-III). U.S. Alcohol Epidemiologic Data Reference Manual, Volume 10, April 2016, NIH. Publication No. 16-AA-8020. Bethesda, MD: National Institute on Alcohol Abuse and Alcoholism.