[Test-ED Visits] Understanding Overdose Data
IVPB creates multiple resources to help keep our partners informed about overdoses in NC.
All IVPB overdose data resources can be found on the NC Overdose Epidemic Data webpage. This page includes:
- Summary information on overdose deaths and emergency department (ED) visits in NC over time.
- Interactive overdose data
- Monthly reports
- Other data resources and links to overdose prevention information
IVPB creates and shares these resources to support overdose prevention across NC.

- Permission is not needed to use any of the posted data in your presentations, manuscripts, reports and other work.
If you use IVPB published data, please include a version of the following citation:
NC Department of Health and Human Services, Division of Public Health, Injury & Violence Prevention Branch. ‘[data resource name].“ [webpage data were accessed from]. Accessed [insert access date]. [insert the website address]
For help finding the injury data you need, visit the NC Injury Data Resource Inventory. This interactive tool helps you identify which website or IVPB data source has the information that best meets your needs.
Below is a brief summary of each resource.
Overdose Data Resources
Use the monthly overdose reports for the most up-to-date data on fatal and nonfatal overdoses in your county and across the state.
Monthly Overdose Reports use provisional data to monitor overdose trends in NC before final data are available. These reports can be used to:
- Monitor changes in the number of overdoses happening statewide or at the county level to know when to respond or act.
- Know where overdoses are happening in the state and which groups are experiencing overdoses.
- Focus prevention and response activities to groups that are most impacted by overdose.
For more information on using provisional data to monitor overdoses in NC, visit Using Provisional Overdose Data.
Monthly Overdose Reports are shared through a Google Drive folder.
- Open the folder in the Google Drive for the report you are interested in.
- Select the “Download” button on the far right of the screen to download the report.
Four reports are updated monthly with the most recent data.
Separate reports include data on overdose deaths, the most severe outcome of the overdose epidemic, and non-fatal overdoses. Use the reports together for a more complete picture of overdoses across the state.
| Report Name | Description |
|---|---|
| Suspected Overdose Deaths |
|
| Fentanyl-Positive Deaths | This report can be used as an early estimate for overdose deaths, since most overdoses (about 80%) in NC involve fentanyl.
|
| Opioid Overdose Emergency Department (ED) Visits |
|
| All Drug Overdose Emergency Department (ED) Visits |
|
There are additional overdoses that may not be captured in these reports, for example, if someone does not seek medical treatment after an overdose. But these reports can provide important context to support planning and response.
Use the interactive overdose data tool to access overdose data if you are comfortable using data dashboards to query and filter data.
The interactive overdose data can be used to:
- Filter data for metrics by place, statewide or by county.
- Monitor changes in the number and rate of overdose metrics to help know when to respond or act in your community.
- Compare the change in the selected metric from year to year.
- Compare the rates for the selected metric to the statewide rate and across counties.
- Monitor whether rates for a selected place (state/county) are high, low, or about the same as the rate for other places in NC over time.
Overview of Overdose Metrics
The interactive overdose data include metrics that describe overdose deaths, ED visits, opioid and buprenorphine dispensing, opioid use disorder treatment services, and foster care due to parental substance use.
- Some metrics are reported as a rate per 100,000 while others are reported as a percentage (rate per 100).
- For more information on the differences between these rates, visit Understanding Counts and Rates.
- The timeframe of data used for each metric and how often data are updated depends on the source of the data.
- For more detailed information on the case definitions used for each metric, visit NC IVPB Injury Case Definitions. [UPDATE link]
Death Data Metrics
- Include annual data for 2010 forward.
- The death metrics for the most recent year are projected yearly estimates based on what has been reported so far. For example:
- There were 1,071 overdose deaths from Jan – Apr 2024, representing a projected 3,213 overdose deaths in 2024.
- There were 1,071 overdose deaths from Jan – Apr 2024, representing a projected 3,213 overdose deaths in 2024.
ADD IMAGE
- Estimates will always be made using at least three months of provisional data.
- For example, estimates of 2025 overdose deaths will not be reported until data for Jan-Mar 2025 are close to being complete, likely in March 2026.
- Because of these data availability requirements and the delay in death data, there is at least a 3-month lag in reporting projected deaths for the previous year.
- These estimates of overdose death are updated monthly and likely become more accurate as additional cases are finalized.
- For more information, visit Using Provisional Overdose Data or the general injury provisional factsheet.
ED Visit Data Metric
- Includes annual data for 2016 forward. See Using Provisional Data for Monitoring Injuries for more information.
- ED visit data are the timeliest data available but take time to finalize.
- ED visit data are updated monthly with a one-month delay in reporting.
- The most recent ED visit data are provisional and subject to change as visit data are finalized. For more information, visit Using Provisional Overdose Data.
- The ED visit data metric for the most recent year is also a projected yearly estimate based on what has been reported so far.
- See the example above for Death Data Metrics.
Other Metrics
- All other metrics are updated annually with the most recent year of final data.
- Controlled Substances Reporting System (CSRS) metrics include data for 2013 forward.
- Division of Mental Health, Developmental Disabilities, and Substance Use Services (DMH) treatment metric includes data 2014 forward.
- Division of Social Services (DSS) metric includes data for 2015 forward.
Use the downloadable statewide overdose data to conduct your own analyses and create your own data visualizations using NC overdose data.
All of the data used to populate the Interactive Overdose Data on the NC Overdose Epidemic Data webpage are included in a downloadable CSV file.
- Data are available for each metric at the state and county level.
- Each row represents the data for a given metric for each year and each place (county/statewide).
- Data include the number of events for each metric, the rate (percentage or rate per 100,000 NC population), and the change in the rate compared to the previous year.
- There is an accompanying data dictionary available that describes each of the variables included in the downloadable data.
Use the core overdose prepared PowerPoint slides to include overdose data in your next presentation, or as a resource to understand more about overdoses in NC.
The Core Overdose Slide Set gives an overview of the history of the epidemic in NC, present statewide overdose trends, our state’s actions to prevent overdoses, and the connection between overdoses and other public health topics.
These slides can be used to:
- Understand the who, what, when, where, and why of overdose in NC.
- These PowerPoint slides are meant to offer a state-level background on drug overdose.
- The slides were created to provide basic data trends and public health surveillance around the drug overdose epidemic.
- Incorporate overdose data into your own presentations, grant proposals, reports, or any other way they may be useful.
- Each slide includes detailed notes explaining the information on the slide.
- Technical notes are also available to help with understanding and presenting data.
NC-SUDORS combines data from death certificates, medical examiner reports, and toxicology results. The system is a critical tool for understanding the overdose epidemic and providing high quality data to guide public health interventions.
These data include information on circumstances surrounding unintentional overdose deaths, like overdose and substance abuse treatment history, routes of drug use, and if naloxone was given.
Case-Level Data
Use case-level NC-SUDORS data to research overdose deaths of unintentional and undetermined intent or to inform local overdose response efforts.
- Researchers may request NC-SUDORS data to conduct their own research.
- Local health departments may request their jurisdiction’s NC-SUDORS data to aid in their response efforts, including overdose fatality reviews.
- More information on how to request detailed case-level NC-SUDORS data is available on the NC Overdose Epidemic Data webpage.
NC-SUDORS Factsheets
Use NC-SUDORS fact sheets for data on overdose deaths by county and congressional district.
NC-SUDORS creates fact sheets for each NC county and congressional district that include data specific to that area of the state. These factsheets can be used to:
- Understand which groups are experiencing overdoses within a given county or congressional district
- Understand how overdoses in a county or congressional district compare to overdoses across the state.
- Understand the circumstances surrounding overdoses in a given county or congressional district to help inform overdose prevention in that area.
Use these additional data resources to understand factors that contribute to the overdose crisis in NC.
- Resources include information on mental health and overdose, homelessness and overdose, and other overdose-related topics.
What Are Provisional Data?
Provisional data are early numbers that have not been fully checked or do not have all the information they normally have before being considered final.
Provisional data allow us to:
- Access information quickly.
- Spot changes in injury trends before the final data are ready.
- See patterns that help us know when to take action.
For more information on provisional data and when they become available, visit How IVPB Uses Provisional Data.
What to Know
- Because data are always being collected and updated, provisional data can change as new information is added.
- How complete provisional data are varies by data source, data system, and when the data are accessed.
- The quality and completeness of the information can also be different for different groups of people.
Whenever provisional data are used a note should be included to indicate the data are provisional.
- This allows people to know that the data can change so they can use the data appropriately.
- For example:
- Report Title – North Carolina Emergency Department (ED) Visits for Opioid Overdose: April 2025* Update
- Report Footnote – *Data for 2024 - 2025 ED visits are provisional.
- ED data from the NC Disease Event Tracking and Epidemiologic Collection Tool (NC DETECT) are used to create monthly overdose reports at the state and county levels on ED visits for opioid overdose and ED visits for all drug overdoses.
- These reports are posted to the NC IVPB Overdose Epidemic Data website and are shared with partners across the state to help health officials and communities make decisions.
Provisional ED visit data are also available to authorized local or state public health users in “near real time” through the NC DETECT data portal. Since the data are updated often, running the same search at different times might give varying results as new information is added.
Using provisional death certificate data as soon as they are reported can show fewer overdose deaths than there really were.
This is because some records may not be fully updated with the correct overdose code.
- There is a delay in death certificate data in all states.
- Overdose deaths take longer to finalize because they need time for investigation.
- It takes time to confirm the cause of death and assign an International Classification of Diseases 10 (ICD-10) code. These are codes used to classify and describe the primary and underlying causes of death.
- Coding of death certificates currently takes longer in NC than in most other states because of system changes and delays in autopsy reporting.
- Provisional death certificates may have a pending ICD-10 cause of death code (R99) when they are first reported into the state’s system to track death records, NC DAVE (Database Application for Vital Events).
- This code is usually updated to a more specific cause of death code before the
- NC death certificate data are finalized.
- Many deaths confirmed as overdoses in the final death certificate data were first reported to NC DAVE with a R99 code.
Why is this important?
- CDC, the media, and others report estimated overdoses for states using data states submit to a national system at CDC.
- For NC, using provisional data from the national system can be a problem.
- Longer delays in death certificate coding in NC may cause provisional data to be more incomplete than they are for other states.
- Delays in coding can make it look as if there have been fewer overdose deaths in NC than there really were.
Each indicator considers the delay in death certificate coding in its own way.
Because of this, data from the Centers for Disease Control and Prevention (CDC) and other NC programs can be different from the data shared by IVPB. NC and national indicators are described further below.
IVPB has worked with the Office of the Chief Medical Examiner (OCME) to create faster indicators to track overdose deaths using OCME data.
- These indicators are used to create the IVPB Monthly Overdose Reports on suspected overdose deaths and fentanyl-positive deaths.
- For more information on differences between IVPB data and other sources, visit Differences in Reported Data.
Not all overdose deaths have been assigned an ICD-10 code for overdose in the provisional death certificate data yet.
- This can make it seem like there has been a big decrease in overdoses in NC.
- The NC Suspected Overdose Deaths indicator using OCME data provides a more realistic idea of the changes in overdose deaths in the state.
- IVPB waits 6 months before using provisional death certificate data, allowing more time for overdose deaths to be assigned an ICD-10 code for overdose.
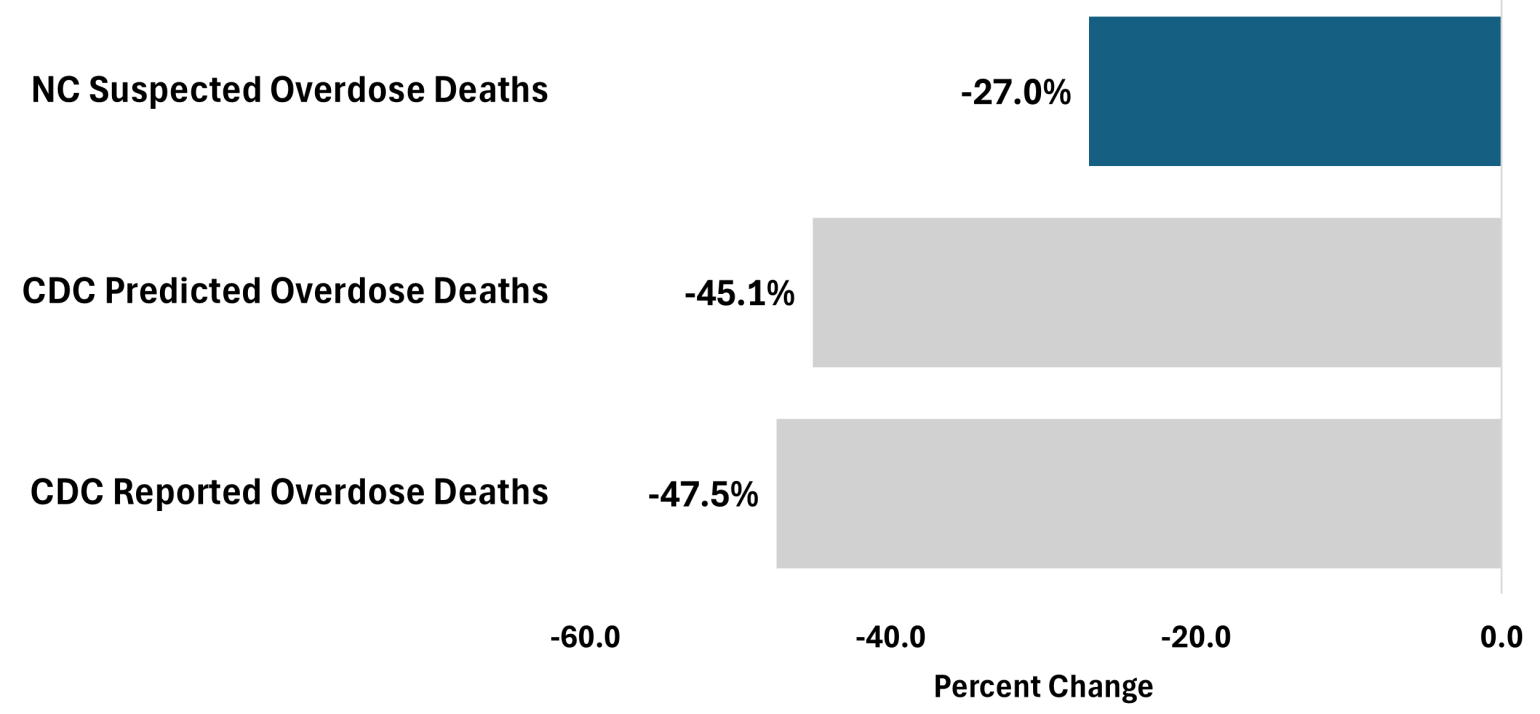
Percent Change in the Number of Overdose Deaths from October 2023 to October 2024 Across Provisional Overdose Death Indicators
For more information on differences between IVPB data and data reported from other sources, visit Differences in Reported Data.
Indicators to Track Provisional Overdose Deaths in NC
Indicators Recommended by NC
NC Suspected Overdose Deaths
- Estimates overdose deaths using data from OCME.
- Gives a more accurate and up-to-date count of overdose deaths.
- Only available at the state-level with a one-month delay.
- Some suspected overdoses may be reported as non-poisoning deaths in the final death certificate data, but most are confirmed as poisoning deaths.
- There was a 2% difference between the number of suspected and confirmed overdose deaths from 2019-2023.
Last 24 Months of Overdose Deaths, Comparing Death Certificates Coded for Overdose to the Suspected Overdose Indicator Using OCME Data
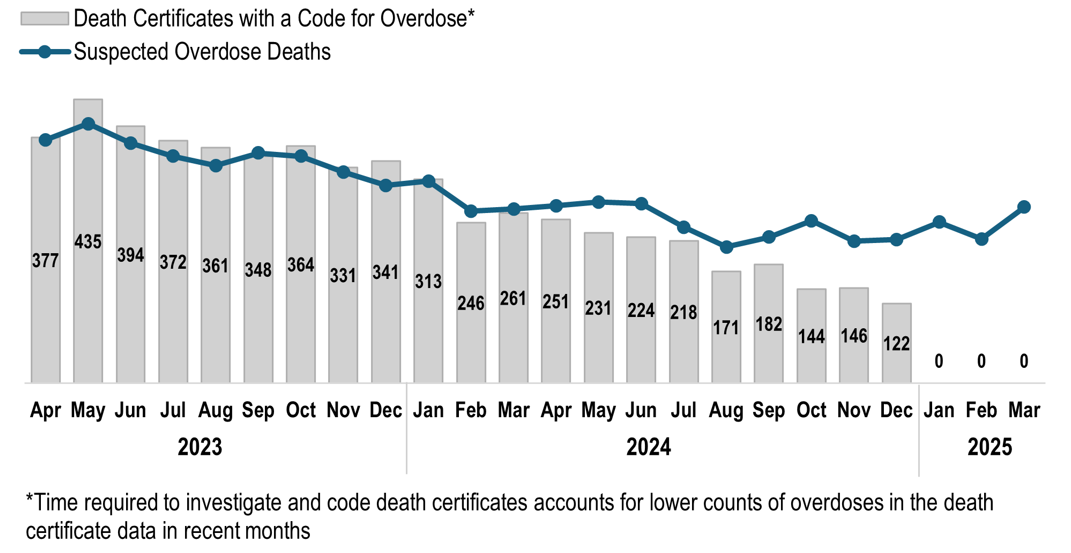
| Year | Month | Suspected Overdose Deaths | Death Certificate with a Code for Overdose |
|---|---|---|---|
| 2023 | April | 373 | 377 |
| 2023 | May | 398 | 435 |
| 2023 | June | 368 | 394 |
| 2023 | July | 348 | 372 |
| 2023 | August | 334 | 361 |
| 2023 | September | 353 | 348 |
| 2023 | October | 348 | 364 |
| 2023 | November | 324 | 331 |
| 2023 | December | 303 | 341 |
| 2024 | January | 310 | 313 |
| 2024 | February | 264 | 246 |
| 2024 | March | 267 | 261 |
| 2024 | April | 272 | 251 |
| 2024 | May | 278 | 231 |
| 2024 | June | 275 | 224 |
| 2024 | July | 239 | 218 |
| 2024 | August | 209 | 171 |
| 2024 | September | 224 | 182 |
| 2024 | October | 249 | 144 |
| 2024 | November | 218 | 146 |
| 2024 | December | 220 | 122 |
| 2025 | January | 247 | 0 |
| 2025 | February | 221 | 0 |
| 2025 | March | 270 | 0 |
Fentanyl-Positive Deaths
- Tracks deaths that tested positive for fentanyl but have not yet been confirmed with a final cause and intent of death using OCME toxicology data.
- Available at the state and county level with a three-month delay.
- Can be used as an early estimate when death certificate data have not been coded yet, since most overdoses in NC involve fentanyl (about 80%).
- It may be decided that fentanyl was not the main cause of death, but most are reported as overdoses.
CDC Indicators
CDC Predicted Overdose Deaths
- Created by the CDC to help estimate how many people died from overdoses across the country and in each state/jurisdiction.
- Uses provisional data that are regularly reported to the National Center for Health Statistics (NCHS) from states and jurisdictions.
- Factors in missing overdose death reports.
- Can still underestimate overdose deaths because of the delays in coding.
CDC Reported Overdose Deaths
- Measures the number of deaths that have been reported and labeled with an ICD-10 code for an overdose in the death certificate data.
- Underestimates the true number of overdose deaths because of the longer delay in coding in the death certificate data.
- May miss overdose deaths in NC that get an ICD-10 code after the National Vital Statistics data are finalized.
For more information on differences between NC and national data sources, visit Differences in Reported Data.
Overdose Data Considerations
IVPB overdose data can be used many ways, from identifying risks, tracking trends, and developing effective prevention strategies, to supporting advocacy, funding decisions, and public awareness campaigns.
This document outlines what you should know and consider before using the data included in the IVPB overdose data resources.
Language Matters
The language used to describe and communicate overdose has important impact on overdose prevention.
Negative language can contribute to stigma.
Stigma is when someone is viewed in a negative way because of particular characteristics or attributes, like their skin color, culture, substance use, or mental illness.
Negative language and stigma about substance use can make it harder for people to use drugs to ask for help or get the support they need.
- Stigmatizing words such as "addict" reduce a person to only their drug use.
- Not everyone who uses drugs has a substance use disorder or requires treatment.
- Referring people who use drugs and talking about substance use disorder in a more accurate and humanizing way can reduce stigma and help people receive appropriate treatment or support.
For more information on suggested language to use, words and phrases to avoid when talking about overdose and substance use, and other ways to stop stigma, visit Stop the Stigma.
More information on stigma and overdose is available at:
Updates to Indicators Used to Monitor Overdose Emergency Department Visits
In 2025, IVPB updated the indicators used to monitor emergency department (ED) visits for overdoses of unintentional and undetermined intent in the North Carolina Disease Event Tracking and Epidemiologic Collection Tool (NC DETECT).
These indicators track ED visits related to acute medication/drug overdoses, including opioid overdoses. They do not include ED visits related to alcohol or chronic effects of substance use, unless a medication/drug overdose was also identified within the visit.
This change in the indicators:
- Identifies more ED visits due to overdose in NC DETECT.
- Aligns IVPB case definitions for overdose ED visits more closely to CDC overdose case definitions that were released in 2024.
- Visit the “About nonfatal overdose syndromic surveillance” drop-down on the CDC Drug Overdose Surveillance and Epidemiology (DOSE) webpage for more information on CDC overdose case definitions.
- Gives a more realistic idea of the burden of overdose in NC.
What is Syndromic Surveillance?
Sydromic surveillance systems help to detect, understand, and monitor health
threats quickly, in near real time.
- These systems use syndromes, a type of indicator, to identify ED visits based on keywords and phrases, as well as ICD-10-CM diagnosis codes.
- For more information, visit Understanding Surveillance Case Definitions.
- NC DETECT is NC's statewide syndromic surveillance system.
- NC DETECT is the timeliest data source available to monitor overdoses.
Monthly Overdose ED Visit Reports have been updated to use these new indicators.
What Changed
Case definitions for NC overdose indicators were updated to be more similar to indicators the CDC uses.
Below is a comparison of what elements are included in the new NC indicators and the CDC indicators compared to the old NC indicators.
| Elements of Overdose ED Visit Indicators | CDC/New NC Indicators | Old NC Indicators |
|---|---|---|
| ICD-10-CM Codes for Unintentional Overdoses | x | x |
| ICD-10-CM Codes for Overdoses of Undetermined Intent | x | |
| ICD-10-CM F-Codes for Substance Abuse with Intoxication | x | |
| Overdose Keywords in the Chief Complaint Field | x |
The table above shows the differences between what is included in the new NC and CDC overdose indicators and what was included in the overdose indicators NC used previously.
New indicators find about 450 more overdose cases statewide each month. However, the trend, or overall pattern in overdose ED visits over time does not change.
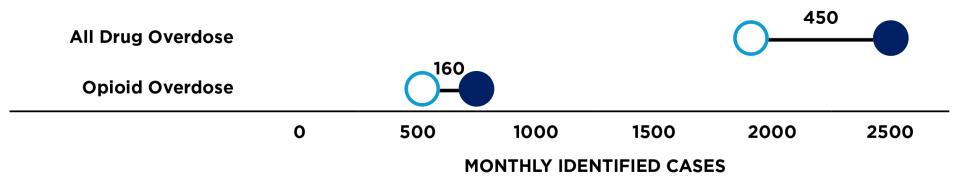
The figure above shows the difference in the estimated number of all drug overdoses and of opioid overdoses that were identified using the old NC indicator compared to the new NC indicator. The new indicator identifies additional ED visits for both indicators.
Why Were the NC Overdose Indicators Updated?
The CDC released updated overdose case definitions in 2024. After validating the new CDC case definitions, IVPB decided to implement similar changes to align NC's overdose case definitions more closely to CDC's.
- IVPB compared the CDC indicators used to monitor overdose ED visits nationally with NC indicators in NC DETECT.
- CDC indicators identified more cases by using overdose keywords found in the chief complaint, ICD-10-CM codes for substance abuse and overdoses of undetermined intent, and additional ICD-10-CM codes in their case definitions.
- Including keywords can help find ED visits for overdoses that haven’t been assigned an ICD-10-CM code for an overdose yet.
- After a detailed review, most of these additional cases could be validated as overdoses and should be included.
Please reach out to us with any questions you may have about this change.
- Email us at SubstanceUseData@dhhs.nc.gov, or
- Schedule time to chat with an IVPB epidemiologist during our Epidemiology Office Hours.
- See the custom injury data request page for more details.
Overdose Indicators
In 2025, IVPB updated the indicators used to monitor emergency department (ED) visits for overdoses of unintentional and undetermined intent in the North Carolina Disease Event Tracking and Epidemiologic Collection Tool (NC DETECT).
These indicators track ED visits related to acute medication/drug overdoses, including opioid overdoses. They do not include ED visits related to alcohol or chronic effects of substance use, unless a medication/drug overdose was also identified within the visit.
This change in the indicators:
- Identifies more ED visits due to overdose in NC DETECT.
- Aligns IVPB case definitions for overdose ED visits more closely to CDC overdose case definitions that were released in 2024.
- Visit the “About nonfatal overdose syndromic surveillance” drop-down on the CDC Drug Overdose Surveillance and Epidemiology (DOSE) webpage for more information on CDC overdose case definitions.
- Gives a more realistic idea of the burden of overdose in NC.
What is Syndromic Surveillance?
Syndromic surveillance systems help to detect, understand, and monitor health
threats quickly, in near real time.
- These systems use syndromes, a type of indicator, to identify ED visits based on keywords and phrases, as well as ICD-10-CM diagnosis codes.
- For more information, visit Understanding Surveillance Case Definitions.
- NC DETECT is NC's statewide syndromic surveillance system.
- NC DETECT is the timeliest data source available to monitor overdoses.
Monthly Overdose ED Visit Reports have been updated to use these new indicators.
What Changed
Case definitions for NC overdose indicators were updated to be more similar to indicators the CDC uses.
Below is a comparison of what elements are included in the new NC indicators and the CDC indicators compared to the old NC indicators.
| Elements of Overdose ED Visits Indicators | CDC/New NC Indicators | Old NC Indicators |
|---|---|---|
| ICD-10-CM Codes for Unintentional Overdoses | x | x |
| ICD-10-CM Codes for Overdoses of Undetermined Intent | x | |
| ICD-10-CM F-Codes for Substance Abuse with Intoxication | x | |
| Overdose Keywords in the Chief Complaint Field | x |
The table above shows the differences between what is included in the new NC and CDC overdose indicators and what was included in the overdose indicators NC used previously.
New indicators find about 450 more overdose cases statewide each month. However, the trend, or overall pattern in overdose ED visits over time, does not change.
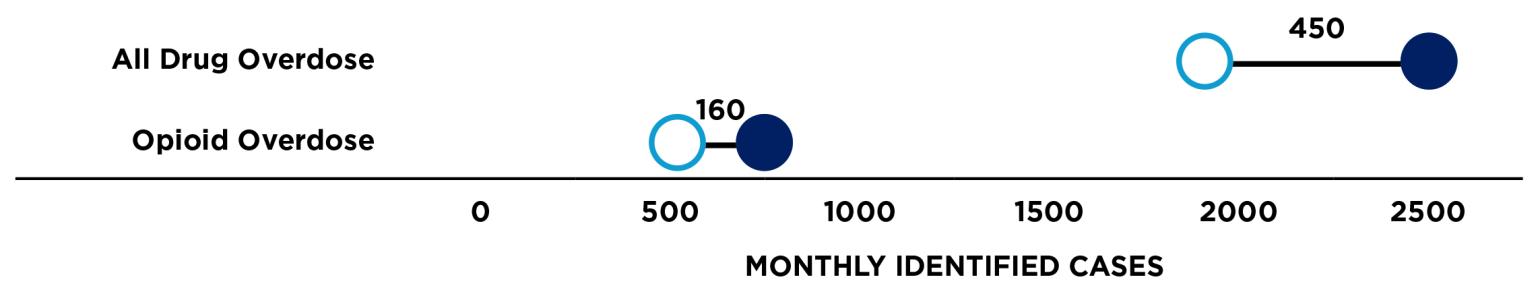
The figure above shows the difference in the estimated number of all drug overdoses and of opioid overdoses that were identified using the old NC indicator compared to the new NC indicator. The new indicator identifies additional ED visits for both indicators.
Why Were the NC Overdose Indicators Updated?
The CDC released updated overdose case definitions in 2024. After validating the new CDC case definitions, IVPB decided to implement similar changes to align NC's overdose case definitions more closely to CDC's.
- IVPB compared the CDC indicators used to monitor overdose ED visits nationally with NC indicators in NC DETECT.
- CDC indicators identified more cases by using overdose keywords found in the chief complaint, ICD-10-CM codes for substance abuse and overdoses of undetermined intent, and additional ICD-10-CM codes in their case definitions.
- Including keywords can help find ED visits for overdoses that haven’t been assigned an ICD-10-CM code for an overdose yet.
- After a detailed review, most of these additional cases could be validated as overdoses and should be included.
Questions About IVPB Overdose Data
Contact Us
- Email us at SubstanceUseData@dhhs.nc.gov with questions about IVPB overdose data.
Custom Injury Data Requests
- Visit the custom injury data request page for more information on how to request overdose data from IVPB.
Epidemiology Office Hours
- Schedule time to meet with an epidemiologist to discuss data availability, questions, or custom requests.
- See the custom injury data request page for more details.
Overdose Prevention Information
Additional information about NC’s response efforts can be found on the NCDHHS Overdose Epidemic page.
This page outlines efforts to prevent overdose in NC and includes:
- Information on opioids, syringe and naloxone access, treatment, data, and news on NC’s efforts to combat the overdose crisis
- Syringe Service Programs in NC
- Where to get naloxone
- Where to access opioid use disorder treatment (Opioid Treatment Programs Central Registry)
- Resources for providers and first responders
- NC’s Opioid and Substance Use Action Plan outlining strategies to turn the tide of the overdose epidemic in NC
- NC Opioid and Prescription Drug Abuse Advisory Committee, a community for people working to address the opioid epidemic
- NC Opioid Overdose Settlement website, outlining resources related to the NC Opioid Settlement including settlement payments, spending plans, and funded strategies